The Mother Of All Credit Contractions
By Colin Twiggs
October 11, 3:30 a.m. ET (6:30 p.m. AET)
These extracts from my trading diary are for educational purposes and should not be interpreted as investment or trading advice. Full terms and conditions can be found at Terms of Use.
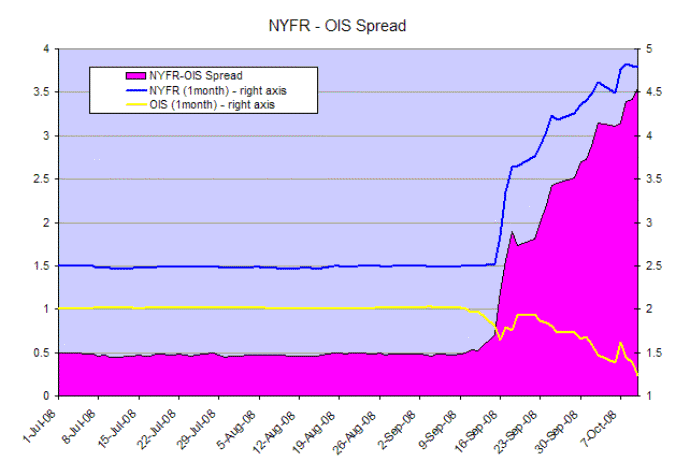
Coordinated government efforts have failed to restore calm to financial markets and we now face the mother of all credit contractions. Yields are falling as investors flee to the safety of short-term treasurys — and NYFR-OIS 1-month spread has reached a record 3.50 percent, signaling that financial markets remain choked. The New York Funds Rate (NYFR) is a new, independently measured, alternative to LIBOR.
Markets are being driven by margin calls and investor withdrawals from investment funds and hedge funds. This is a negative self-reinforcing cycle. In much the same way as an accelerating up-trend inevitably leads to a blow-off, this accelerating down-trend will inevitably reverse. The difficulty is predicting when.
Self-reinforcing cycles, or exponential trends, are often evident in nature — not just the stock market. They all eventually fail when they use up their fuel source. Brushfires will flare from a small flame into a raging inferno within a few hours, especially if fanned by a favourable wind. But they always burn themselves out. Either when they run out of fuel or the wind changes. The same occurs in the stock market. An accelerating up-trend will blow-off when the rising number of profit-takers exceeds the diminishing number of new buyers. Like a giant Ponzi scheme, it eventually has to end. There is never an unlimited number of buyers. In the same way an accelerating down-trend is constrained by the limited number of sellers. As stocks move from weak hands to strong hands selling pressure will exhaust itself. Weak hands are typically leveraged buyers responding to margin calls and Johnny-come-latelys who bought near the top of the cycle. Strong hands are bargain hunters, prepared to buy stocks at fire sale prices and hold them until normality returns. Judging from the unprecedented degree of leverage in the markets, the current sell-off may take longer than usual, but will eventually stabilize.
The role of government and central banks is to limit the long-term damage. They should not try to stem the wave of selling, which would simply overwhelm them, but they must take steps to limit the number of casualties. Back-up and bailout is the order of the day. Provision of preferred share funding to major banks and corporates, such as General Motors, is essential. Terms similar to Warren Buffett's deals with GE and Goldman Sachs, including conversion options, should ensure that taxpayers are rewarded for the risks being taken. Again, actions have to be early and decisive. If regulators wait until the storm threatens, it will be too late.
Guaranteeing bank deposits is essential, but calls to underwrite all bank debt seem unnecessary. The Fed interposing itself as intermediary between lenders and borrowers in the inter-bank market should achieve the same ends.
I was interested to read speculation about who should be the next Treasury Secretary. Candidates proposed were Warren Buffet, John Thain, Paul Volcker, Charles Summers and a host of eminent economists. To me there is only one rational choice: Henry Paulson. Given the circumstances I believe he has done well. And what the markets need now is consistency. You don't change horses mid-stream. I have read members of Congress questioning his integrity and accusations that he is "looking after his mates in Wall Street". While it would be natural to feel some loyalty to GS, the rest of Wall Street were his competitors, not his "mates", and I believe he has demonstrated overriding loyalty to his client: the taxpayer.
The blame game has started. It is human nature to seek a scapegoat when things are going badly. We must have our Jonah to cast overboard in the hope that this will calm the waters. The press are offering up Alan Greenspan and I dare say he shoulders some degree of responsibility. But this crisis is much bigger than a single individual. The entire system is at fault. There are millions of actors who have played their part, most of them unwittingly, including AG. In his defense, he expressed concern over the massive leverage of GSEs Fannie Mae and Freddie Mac in early 2004, but attempts to curb this were blocked by Congress.
Australian Banks
Australian political leaders have assured investors that their banks are safe and enjoy some of the highest ratings (AA) in the world — but they are not immune to the current crisis. They rely on global wholesale markets for about 40 percent of their funding, including $221 billion of short-term debt. The local debate about whether to guarantee deposits and whether to limit this to $20,000 or $100,000 is irresponsible: it only serves to alarm the public. They should have learned from the last few weeks in the US that this is not the time to play party politics. What investors want to see is decisive action. Guarantee all bank deposits and do it now. Big withdrawals can hurt a bank far quicker than the small ones.
Gold & Crude Oil
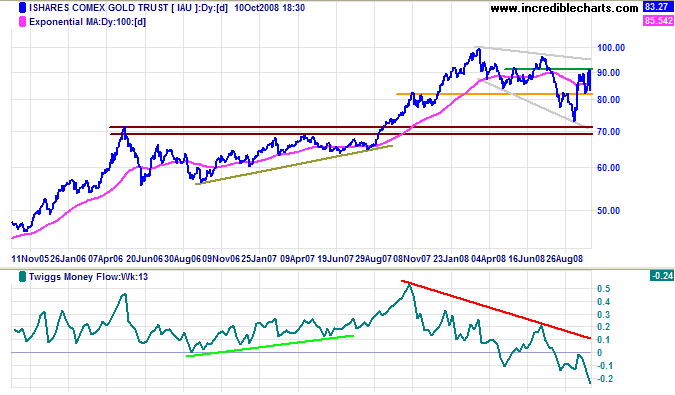
Spot gold displays a bullish descending broadening wedge formation, but this is countered by Twiggs Money Flow (13-week) which signals continued selling pressure on IAU. In the short term, breakout above $910 (IAU reflects 1/10th of an ounce) would test the upper border, while failure of support at $820 would test the lower border — and long-term support around $700 ($710 to $690).
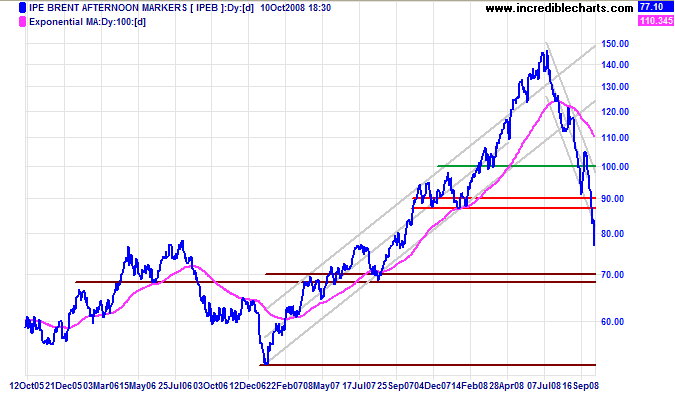
Crude oil broke through the band of support between $90 and $87 per barrel — and is headed for the next band, between $70 and $68. Failure would test the 2007 low of $52/barrel.
USA
Concentrate mostly on long term charts. Short-term support and resistance are easily swamped in times of extraordinary volatility.
Dow Jones Industrial Average
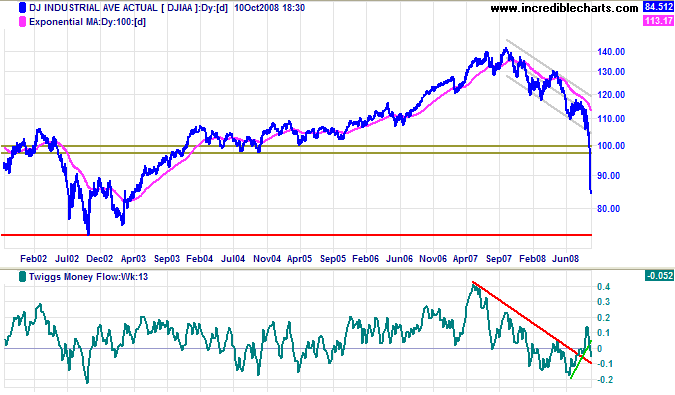
Friday's long tail and strong volume signal buying support at 8000. Judging by the market's recent behavior, reacting negatively to news of rescue efforts and sweeping aside support levels, it remains doubtful whether this too will hold.
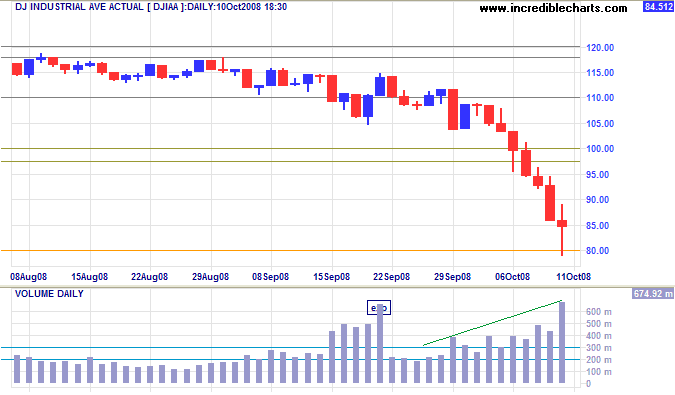
Long Term: Failure of support at 8000, or respect of the new resistance level at 10000, would warn of another down-swing. Expect strong buying support between 7000 and 7200, the low of the 2002 bear market. Fibonacci followers will recognize this as the 50 percent retracement level. Twiggs Money Flow (13-week) is tracking downwards. Be cautious of a bullish TMF divergence if it accompanies a V-bottom on the price chart.
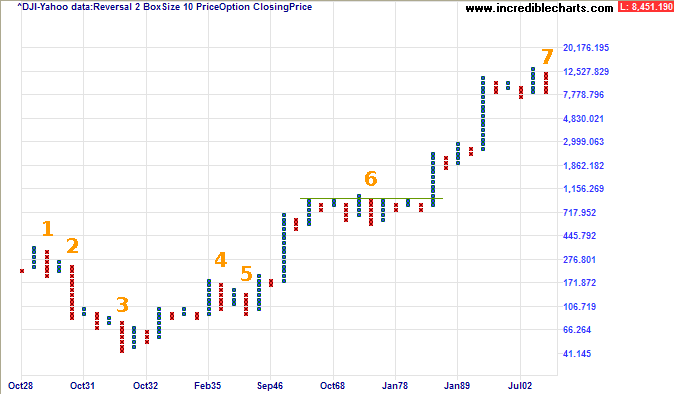
Looking further into the past, the point and figure chart below shows the entire history of the Dow since 1929. There have been seven 50 percent retracements in the last 80 years: the first was the crash of 1929; the next four occurred during the Great Depression which followed; the sixth occurred during the great stagflation of the 1960s and 1970s; and we are now experiencing the seventh. We can learn two things from this. Firstly, [1] to [5] shows that busts do not always occur as single events. Secondly, that major busts tend to result from failures of financial/monetary policy. I believe that we should be able to avoid another depression (like [1] to [5]), but can expect a lengthy period of stagflation, or even deflation, during this massive credit contraction.
S&P 500
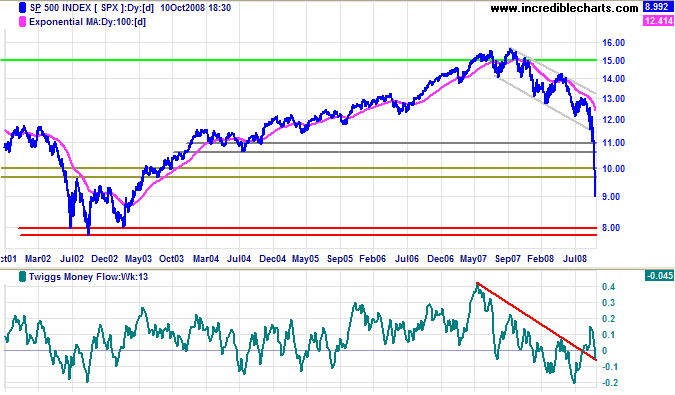
The S&P 500 is testing support at 800 (intra-day). This is also effectively a 50 percent retracement from the 2007 peak. Expect strong buying at this level.
Transport
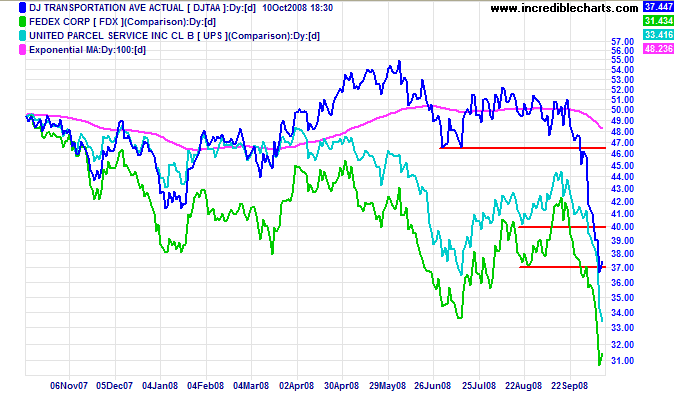
Fedex, UPS and the Transport Average show strong primary down-trends, indicating a further slow-down in the broader economy.
Technology
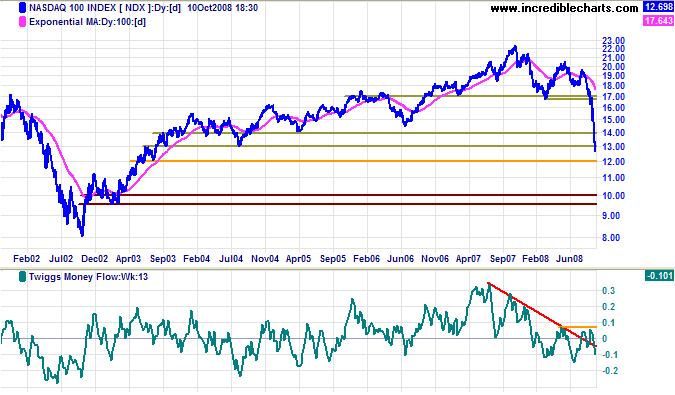
The Nasdaq 100 broke through the major band of support between 1400 and 1300 before finding short-term support at 1200 (intra-day). If 1200 fails, or retracement respects the new resistance level at 1300, expect a test of 1000. Twiggs Money Flow (13-week) signals continued selling pressure.
Canada: TSX
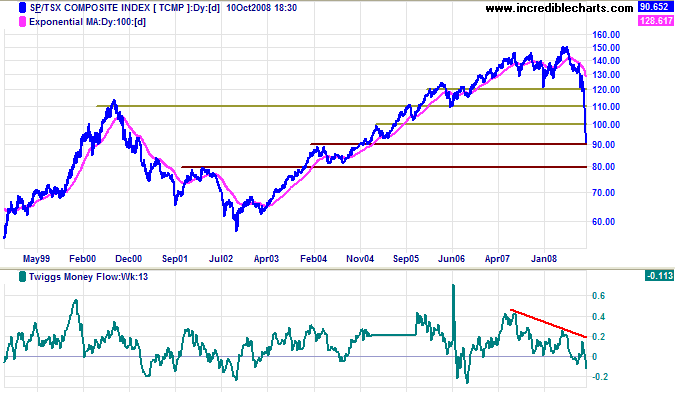
The TSX Composite is also in melt-down, with Twiggs Money Flow (13-week) reflecting strong selling pressure. The index is currently testing support at 9000. If that fails, the next level is relatively close, at 8000.
United Kingdom: FTSE
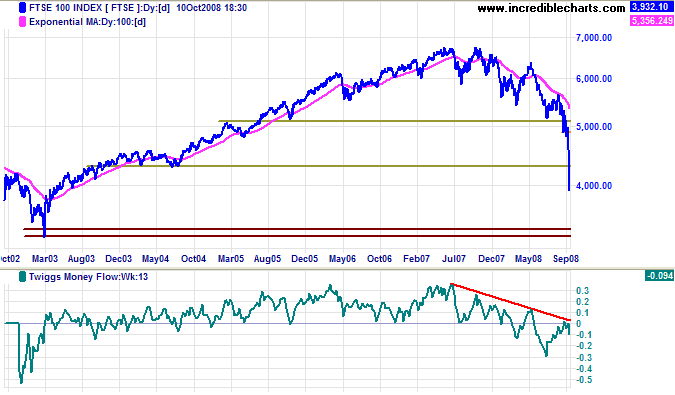
The FTSE 100 went through targeted support at 4300 like a dose of salts. We don't need to look at Twiggs Money Flow (13-week) to confirm there is selling pressure. Unless there is immediate reversal above 4000, we can expect a test of the 50 percent retracement level at 3400 — the 2003 low.
Europe: DAX
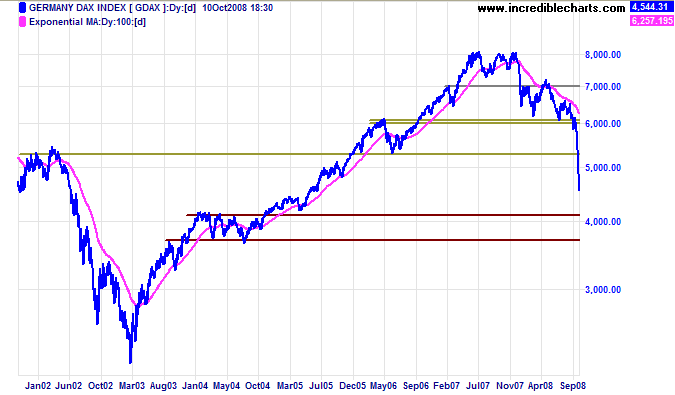
The DAX found short-term support at 4500 (intra-day). If this fails, or retracement respects the new resistance level at 5000, expect a test of the 50 percent retracement level at 4000.
India: Sensex
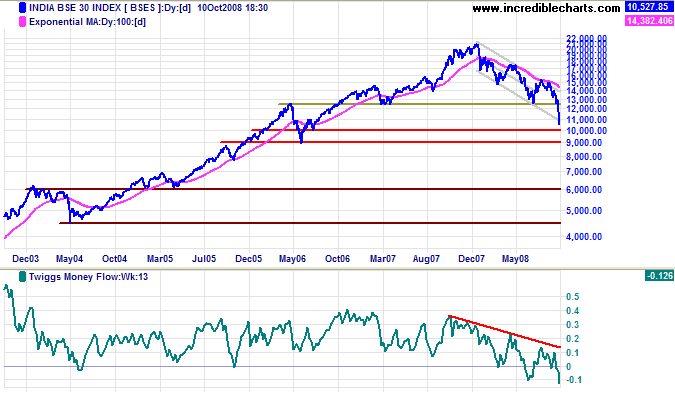
The Sensex is headed for a test of support at 10000, but could overshoot to 9000, the 2006 low. Declining Twiggs Money Flow (13-week) continues to signal long-term selling pressure.
Japan: Nikkei
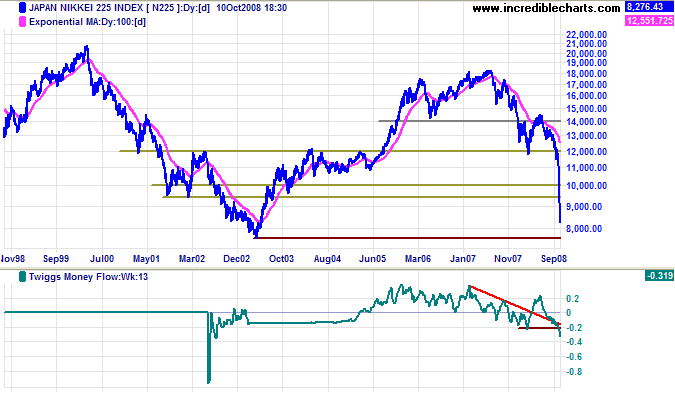
The Nikkei 225 swept through the 50 percent retracement level at 9000 and is headed for at test of the 2003 low at 7600. Expect strong support at this level. Twiggs Money Flow (13-week), as can be expected, reflects selling pressure.
China
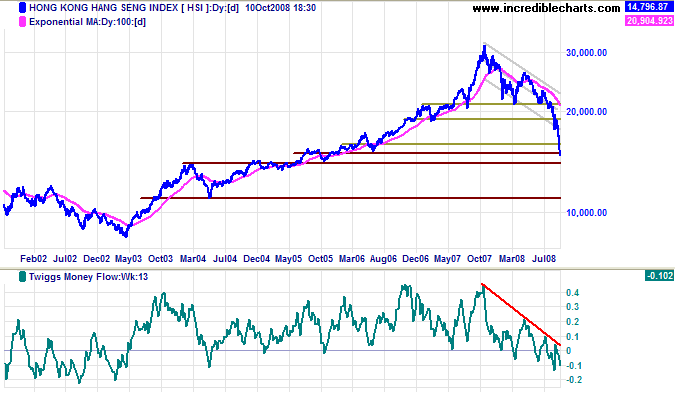
The Hang Seng index swept through the 50 percent retracement level at 16000, before finding short-term support at 14500 (intra-day). Failure of 14000, or retracement that respects 16000 would warn of another down-swing. The next major support level is 11000.
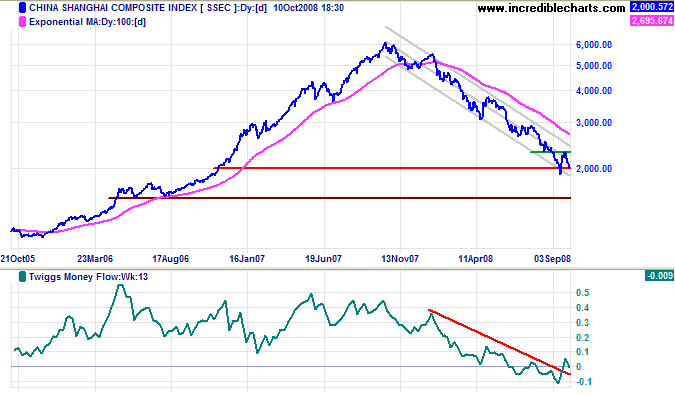
The Shanghai Composite is testing primary support at 2000 — a two-thirds retracement from the 2007 high of 6000. Twiggs Money Flow (21-day) at the zero line signals uncertainty. Failure of 2000 would offer a target of 1500. Breakout above 2300 is unlikely in the present circumstances, but would signal a primary trend change. With their biggest global customer (the US) headed for recession, China's export-led economy is likely to follow.
Australia: ASX
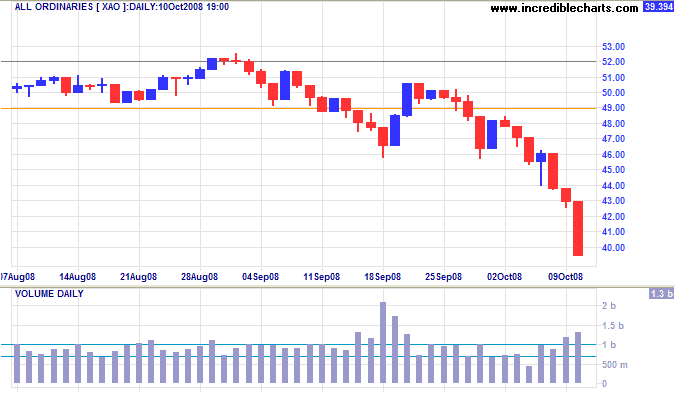
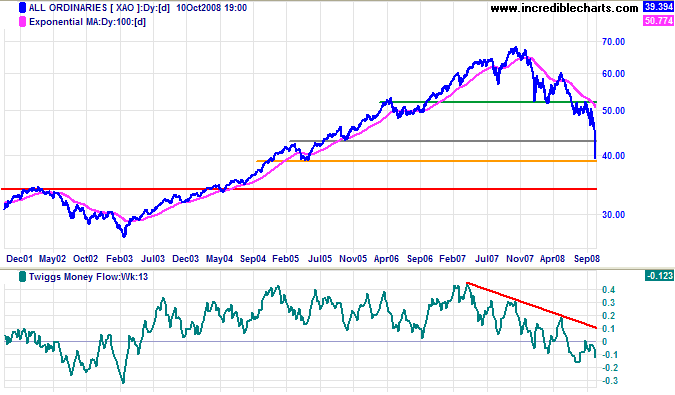
If China goes into recession, Australia will follow. The All Ordinaries is headed for a test of support at 3900, the 2005 low.
Long Term: Failure of support at 3900, or retracement that respects the new resistance level at 4300, would warn of a test of the 50 percent retracement level at 3400. Twiggs Money Flow (13-week) respected the zero line from below, indicating strong selling pressure.
Maintaining Perspective
It is important in these times to maintain perspective and not allow our judgement to be clouded by negative emotions. Rejoice that the sky is still blue, the sun still shines, the birds still sing, the rains still fall, the crops still grow, and our children are healthy. And remember: the sky is always darkest before the dawn.
If you see an express train coming, step off the tracks.
Extending Jesse Livermore's analogy:
it is also important not to step back on the tracks until the last coach has passed.
~ Trading Diary, January 26, 2008

Author: Colin Twiggs is a former investment banker with almost 40 years of experience in financial markets. He co-founded Incredible Charts and writes the popular Trading Diary and Patient Investor newsletters.
Using a top-down approach, Colin identifies key macro trends in the global economy before evaluating selected opportunities using a combination of fundamental and technical analysis.
Focusing on interest rates and financial market liquidity as primary drivers of the economic cycle, he warned of the 2008/2009 and 2020 bear markets well ahead of actual events.
He founded PVT Capital (AFSL No. 546090) in May 2023, which offers investment strategy and advice to wholesale clients.
