A Decade of Deleveraging Ahead
By Colin Twiggs
September 27, 4:00 a.m. ET (6:00 p.m. AET)
These extracts from my trading diary are for educational purposes and should not be interpreted as investment or trading advice. Full terms and conditions can be found at Terms of Use.
The credit bubble, now in the process of contracting, took thirty years to build. It is not going to disappear overnight with a quick (or not so quick) fix from Congress, a few billion invested by Warren Buffett or a sovereign wealth fund, or another rescue package from the Fed. We will face the consequences for at least a decade.
The $10 trillion dollar shadow banking system in the US is only one side of the coin. Many European banks have large investment banking arms and the average ratio of total assets to shareholder equity for European banks is 35, according to Daniel Gros and Stefan Micosi of RGE monitor. Similar leverage ratios to the now-extinct investment banking industry in the US. And some, like Deutsche Bank, with more than € 2 trillion of assets, are too large to be rescued by their home state — meaning that the ECB could be called on to perform a role for which it was not intended.
The reaction to this blow-off is bound to be severe: tighter regulation of financial markets; discouragement of securitization and other methods used to by-pass banking regulation; formalization of the massive credit default swaps market; greater supervision of hedge funds; and closer attention to capital to asset ratios in the banking sector. The result is likely to be a multi-trillion dollar global credit contraction, lasting for a decade or more. The deleveraging process is currently proceeding at too fast a pace for the global economy to handle and measures need to be taken to restore confidence — slowing the process to a gradual phase-down, in order to avoid a crash.
Fundamental v. Technical Analysis
A reader recently asked why I sometimes use technical analysis and at other times use fundamental analysis of global markets to justify my conclusions.
My top down approach is to first examine fundamentals driving the economic cycle before any analysis of charts. Charts do not reveal everything, despite what some technical analysts claim. They may be a useful tool, but they do not embody the full knowledge of everyone in the market.
Markets are open to manipulation, even in this day and age, by many different players who may at times distort market signals for their own ends. Technical analysis is now widely used, which makes market reactions readily predictable. The incidence of false breakout signals has increased to the point that Curtis Faith, in his book Way of the Turtle, claims that breakout trading models are no longer viable.
Apart from scalpers and day traders we also have large fund managers influencing the markets. The temptation, close to quarter end, is sometimes too great to resist. You may see prices supported at artificial levels until after the end of the quarter, especially if bonuses are riding on fund performance.
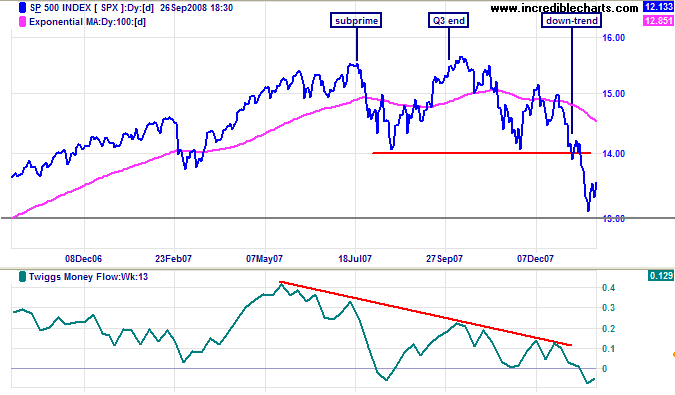
Recent performance of the Dow and S&P 500 at the end of the third quarter in 2007 is one such example. By mid-July 2007 the sub-prime crisis had broken, with most participants aware of problems in the financial sector. But the index bounced off support and, strangely, floated upwards for several weeks, making a new high shortly after quarter end. Then selling began in earnest. Fortunately a large bearish divergence on Twiggs Money Flow gave us a clue as to what was going on, but any serious student of economic fundamentals could have seen the warning signs much earlier.
Sophisticated participants may also attempt to by-pass formal markets, taking positions in unregulated over-the-counter markets in order to conceal their strategy. Goldman Sachs, for example, took massive bear positions in sub-prime markets — in late 2006/early 2007. Almost a year ahead of stock market reaction to the crisis.
Sharing a Lifeboat with an Elephant
You may also remember my recent analogy to "sharing a lifeboat with an elephant". The US economy is the elephant, with annual GDP of $14 trillion equal to the combined (2007) performance of next four largest economies: Japan, Germany, China and the United Kingdom. If the elephant shifts position, everyone is affected. So the next step in my top down approach is to study the US market first. Then attempt to gauge its effect on other markets. Before finally conducting technical analysis of those markets.
The Best Signals
Neither technical nor fundamental analysis is perfect. The best signals are when the two confirm each other.
Crude Oil
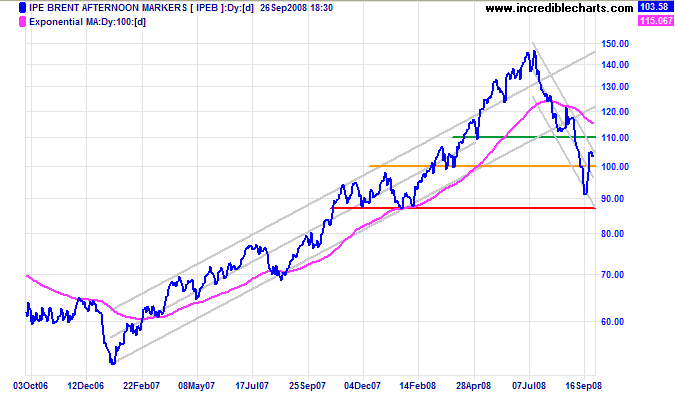
Crude oil is consolidating below the upper border of its downward trend channel — after a sharp rally typical of shorts covering in a bear market. Upward breakout would warn that the down-trend is weakening; but reversal is more likely, followed by a test of support at $87 per barrel, the lower border of the trend channel. Failure of support could lead to crude falling as far as the 2007 low of $50/barrel.
USA
Dow Jones Industrial Average
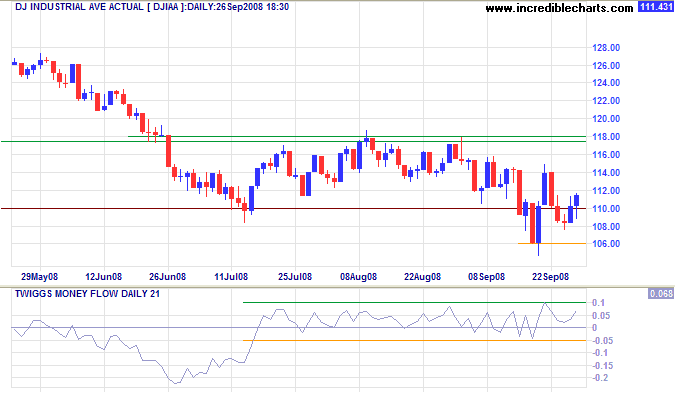
Despite Monday's replacement of American International Group with Kraft Foods the Dow retraced to short-term support at 10800 — as Congress stalled over the troubled assets rescue package ("TARP"). There are signs of growing optimism that TARP will be passed, with Twiggs Money Flow (21-day) signaling short-term buying pressure. Expect announcement of a resolution early in the new week, followed by a relief rally to test 11800.
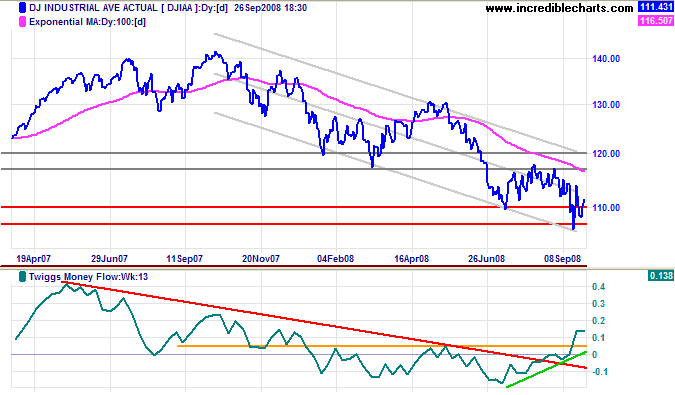
Long Term: Breakout above the upper trend channel (ie. 12000) would signal that the primary down-trend is weakening; while reversal below 10600 would warn of a down-swing with a target of 10000. Twiggs Money Flow (13-week) above its May high does not signal a trend change unless a new trough forms above the July 2008 low.
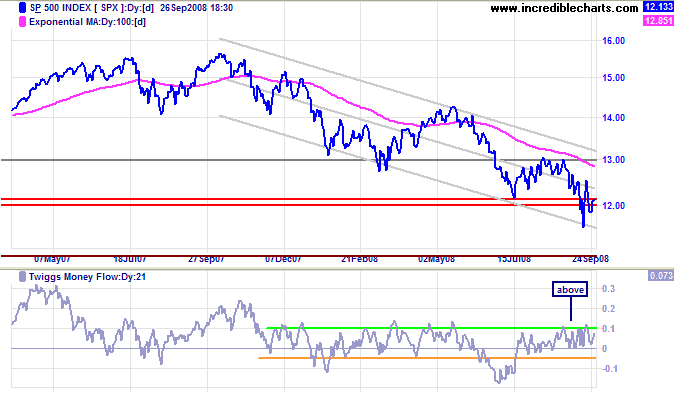
S&P 500
The S&P 500 is testing support at 1200. The same applies as with the Dow: expect a relief rally to test 1300 if TARP is resolved. Twiggs Money Flow (21-day) holding above zero indicates buying pressure. Breakout above the upper trend channel would warn that the primary trend is reversing; but wait for confirmation from the Dow and 13-week Twiggs Money Flow. Volatile markets tend to overreact. Reversal below 1200, on the other hand would warn of another down-swing, with a target of 1100.
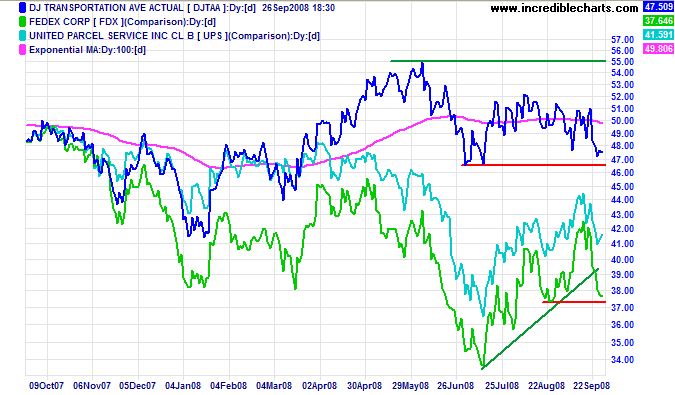
Transport
Fedex is testing primary support and threatens to reverse to a down-trend as oil prices recover above $100.
UPS and the Transport Average would be likely to follow.
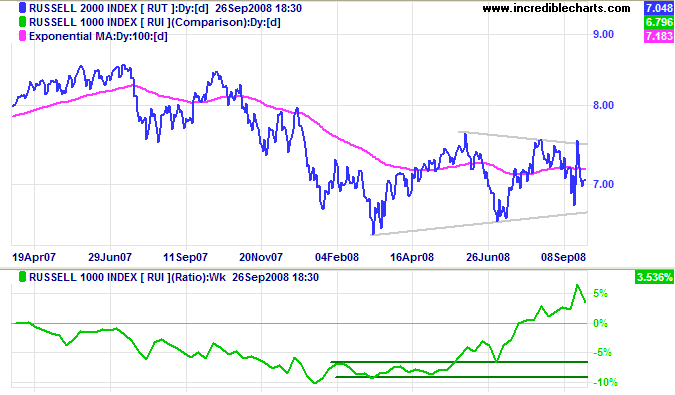
Small Caps
The Russell 2000 Small Caps index made a false break above its large triangle and is now headed for a test of the lower border. Breakout would indicate future direction, but wait for confirmation from a retracement that respects the breakout level. The index continues to out-perform the large cap Russell 1000, with the price ratio rising. Large cap financial stocks are suffering more from the on-going crisis than their small cap counterparts.
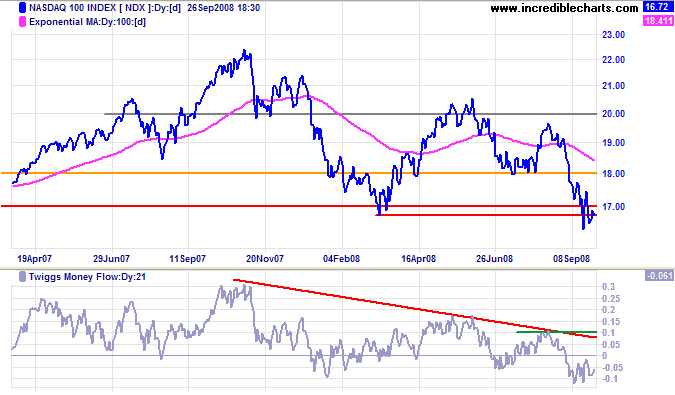
Technology
The Nasdaq 100 is testing medium-term support at 1630. Failure would signal a down-swing with a target of 1400, calculated as 1700 - ( 2000 - 1700 ). Twiggs Money Flow (21-day) remains below zero, signaling selling pressure.
Canada: TSX
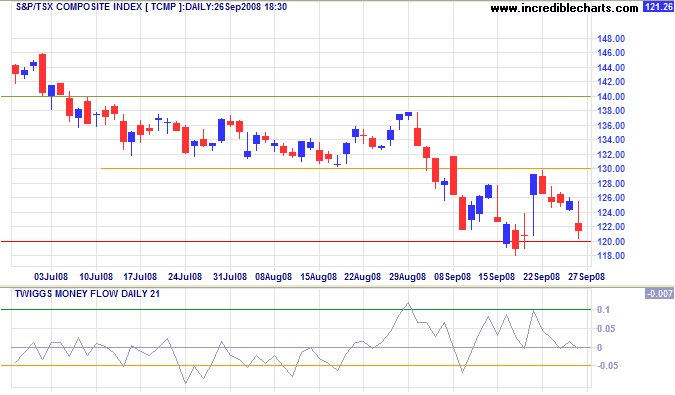
The TSX Composite again retraced to test support at 12000. Failure would signal a test of the June 2006 low at 11000, while recovery above 13000 would test 14000. Expect a relief rally, but the index remains in a primary down-trend and another down-swing remains likely. Twiggs Money Flow (21-day) at the zero line indicates uncertainty.
United Kingdom: FTSE
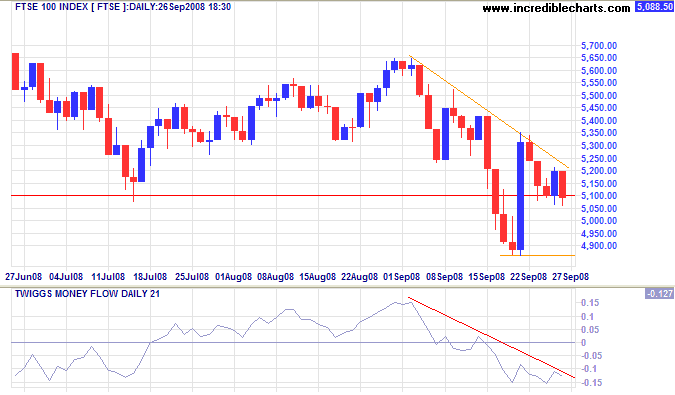
The FTSE 100 is testing support at 5100. Recovery above 5350 would signal a bear market rally to test 5650. But the primary trend remains down and Twiggs Money Flow (21-day), below zero and declining, signals strong selling pressure. Breakout below 5000 would test 4900. In the longer term, failure of 4900 would test 4300, the low of August 2004.
Europe: DAX
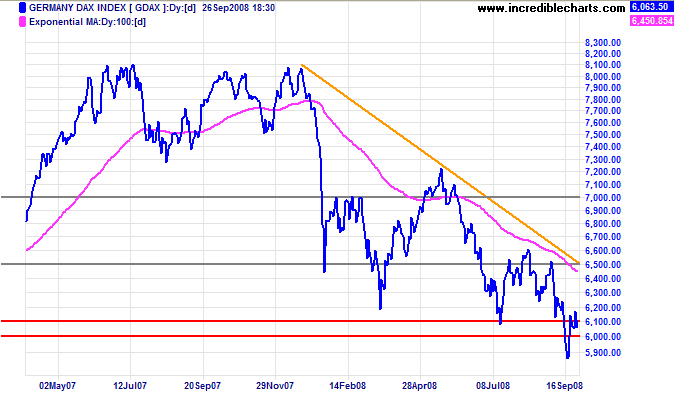
The DAX is testing long-term support at 6000. Breakout above 6500 is unlikely; while reversal below 6000 would signal another down-swing — with a target of 5300, the June 2006 low.
India: Sensex
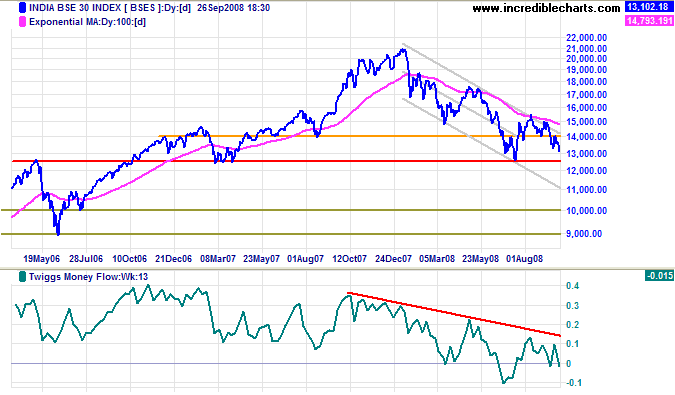
The Sensex is headed for a test of 12500 after respecting resistance at 14000. The primary trend remains down and failure of 12500 would warn of a down-swing with a target of 10000. Declining Twiggs Money Flow (13-week) continues to signal long-term selling pressure.
Japan: Nikkei
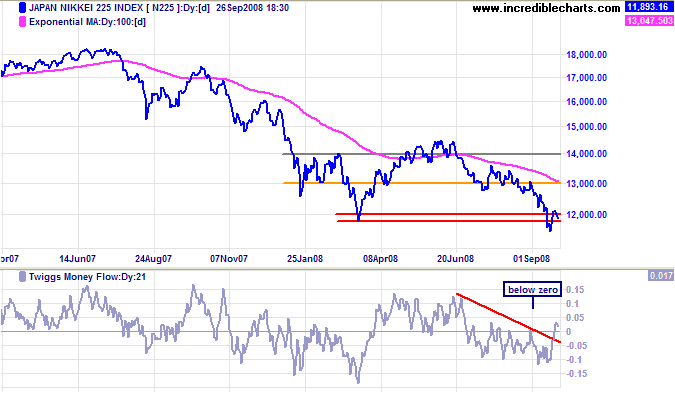
The Nikkei 225 retraced to confirm resistance at 12000. Reversal below 11800 would warn of another down-swing with a target of 10000, calculated as 12000 - (14000 - 12000). Twiggs Money Flow (21-day) crossed to above zero, signaling short-term buying, but the longer term indicator remains bearish.
China
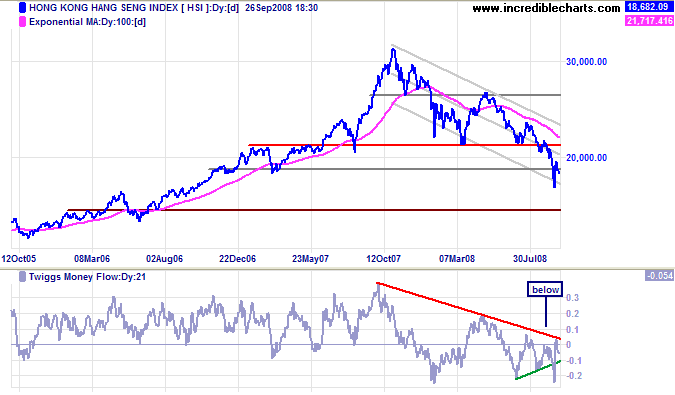
The Hang Seng is headed for another test of the lower trend channel after reversing below 19000. Recovery above 19000 would signal a test of 21000, but the primary trend is down and Twiggs Money Flow (21-day) holding below zero warns of selling pressure. The long term target remains 16000, calculated as 21000 - ( 26000 - 21000 ).
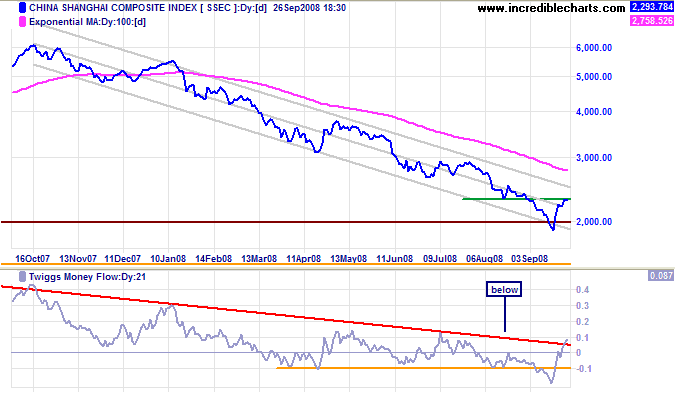
The Shanghai Composite is testing resistance at 2300. Twiggs Money Flow (21-day) crossed to above zero, signaling short-term buying pressure. Expect a test of the upper trend channel, but the primary trend remains down — with a target of 1500.
Australia: ASX
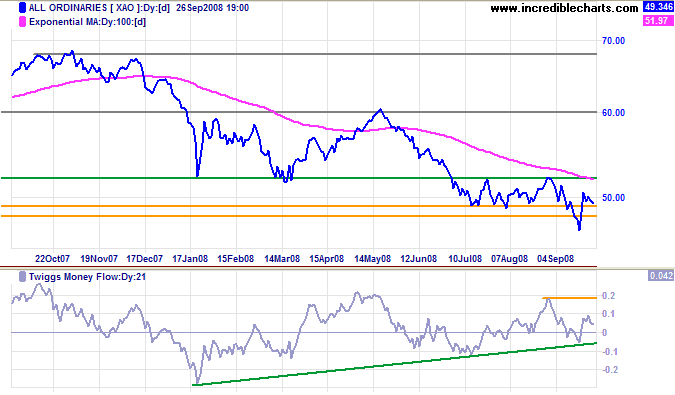
The All Ordinaries is consolidating above 4900 after a sharp rally, with strong volume indicating support. Expect a relief rally to test 5200, following the US markets; signaled by breakout above 5050. Reversal below 4900 is unlikely at present — and would warn of another down-swing.
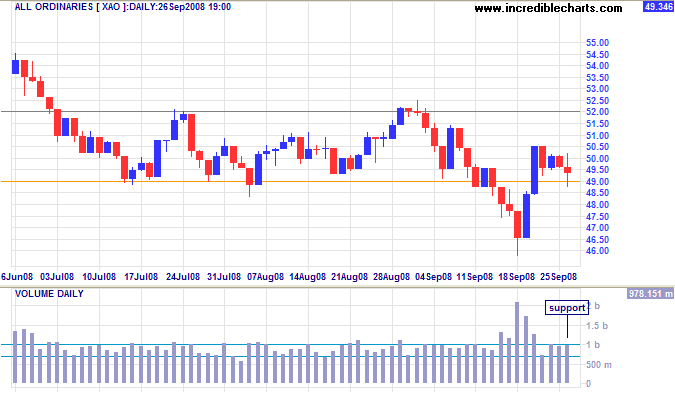
Long Term: We remain in a bear market. Reversal below 4650 would confirm another down-swing, with a target of 4300, the October 2005 low. Twiggs Money Flow (21-day) displays a bullish divergence, but this is not confirmed by the 13-week indicator and would be limited to a secondary rally.
Every now and then the world is visited by one of these delusive seasons,
when the credit system .... expands to full luxuriance: everybody trusts everybody;
a bad debt is a thing unheard of; the broad way to certain and sudden wealth lies plain and open;
and men are tempted to dash forward boldly from the facility of borrowing.
Promissory notes, interchanged between scheming individuals, are liberally discounted at the banks.....
Every one now talks in [bodacious amounts]; nothing is heard but gigantic operations in trade;
great purchases and sales of real property, and immense sums [are] made at every transfer.
All, to be sure, as yet exists in promise; but the believer in promises calculates the aggregate as solid capital.....
Now is the time for speculative and dreaming or designing men.
They relate their dreams and projects to the ignorant and credulous,
dazzle them with golden visions, and set them maddening after shadows.
The example of one stimulates another; speculation rises on speculation; bubble rises on bubble;
every one helps .... to swell the windy superstructure.
Speculation is the romance of trade, and casts contempt upon all its sober realities.
It renders the [financier] a magician, and the Exchange a region of enchantment.....
No operation is thought worthy of attention that does not double or treble the investment.
No business is worth following that does not promise an immediate fortune.....
The subterranean garden of Aladdin is nothing to the realms of wealth that break upon [the] imagination.
Could this delusion always last, .... life .... would indeed be a golden dream; but it is as short as it is brilliant.
~ Washington Irving (1783-1859) in
Crayon Papers about the Mississippi Bubble of 1719.
As related by Dallas Fed's Richard Fisher.

Author: Colin Twiggs is a former investment banker with almost 40 years of experience in financial markets. He co-founded Incredible Charts and writes the popular Trading Diary and Patient Investor newsletters.
Using a top-down approach, Colin identifies key macro trends in the global economy before evaluating selected opportunities using a combination of fundamental and technical analysis.
Focusing on interest rates and financial market liquidity as primary drivers of the economic cycle, he warned of the 2008/2009 and 2020 bear markets well ahead of actual events.
He founded PVT Capital (AFSL No. 546090) in May 2023, which offers investment strategy and advice to wholesale clients.
