Investors Rally Or Shorts Covering?
By Colin Twiggs
September 20, 4:30 a.m. ET (6:30 p.m. AET)
These extracts from my trading diary are for educational purposes and should not be interpreted as investment or trading advice. Full terms and conditions can be found at Terms of Use.
The press is full of headlines about stocks soaring and massive rallies. I cannot imagine too many fund managers rushing out to buy stocks in the middle of a market cave-in. That is how you lose your job. The current rally is not driven by new investors rushing in to snap up bargains. The SEC and UK financial regulators have both banned short selling of financial shares, forcing shorts to cover their open positions — causing a huge upward spike in financial stocks like Morgan Stanley [MS] and Goldman Sachs [GS].
We are undergoing another bear market rally. I often equate these to a drowning man's relief at finding a life-raft — before the realization dawns on him that he is still lost in the middle of the Pacific ocean without food or water.
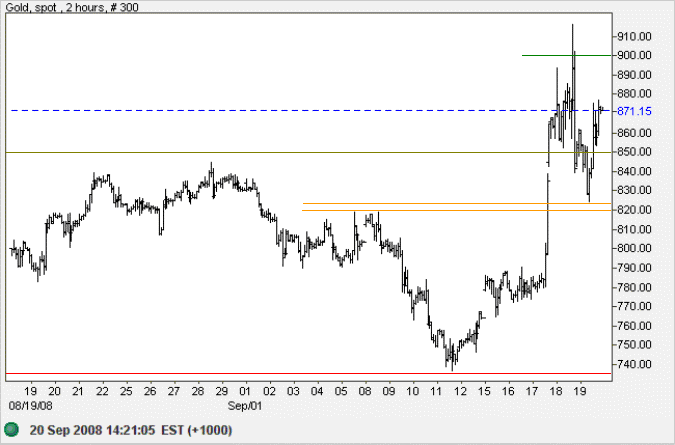
Spot gold climbed sharply during the week as investors fled to the safety of precious metals and treasurys. We can expect sweeping measures from authorities in an attempt to restore stability to financial markets. If successful, the latest gold rally is likely to be short-lived. Breakout above $850 is a large correction which some analysts believe signal the start of a new up-trend. Reversal below $820 per ounce, however, would warn of another test of primary support at $735; while recovery above $900 would confirm the new up-trend.
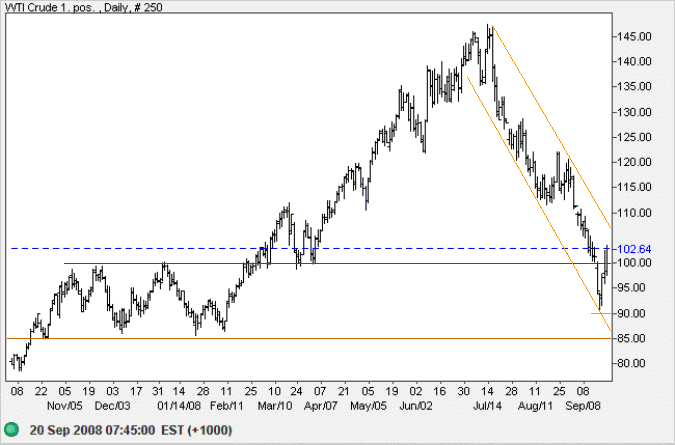
Crude oil is similarly headed for a test of the upper trend channel. Breakout in the middle of a strong primary down-trend is unlikely. Expect a reversal to test support at $85 per barrel. Failure of support could lead to crude falling as far as the 2007 low of $50/barrel.
USA
Dow Jones Industrial Average
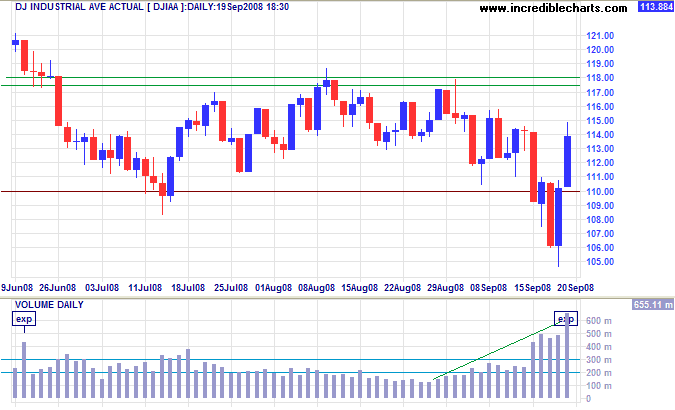
The Dow is headed for a test of resistance at 11800. Strong volume earlier in the week indicates buying support, but Friday's volume spike is due to triple-witching hour: the closing of index options and futures contracts. The rally is not likely to break through resistance — and we can expect another test of 11000.
Do not forget that Kraft Foods will replace American International Group with effect from Monday, providing an artificial boost to the index.
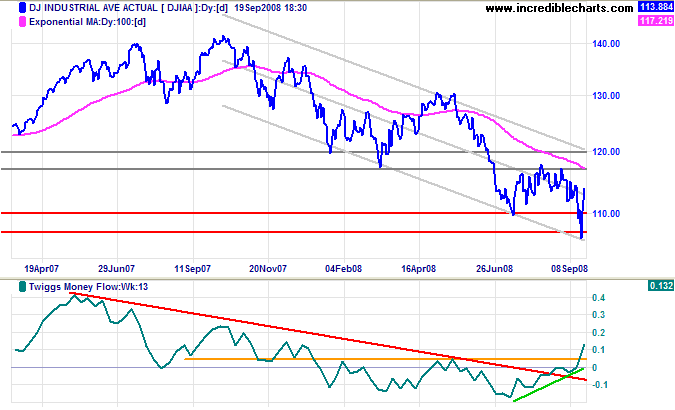
Long Term: Breakout above the upper trend channel (ie. 12000) would signal that the primary down-trend is weakening; while reversal below 11000 would signal a down-swing — with a target of 10000. Twiggs Money Flow (13-week) rose above its May high, forming a "large correction", but this does not signal a trend change unless a new trough forms above the low of July 2008.
S&P 500
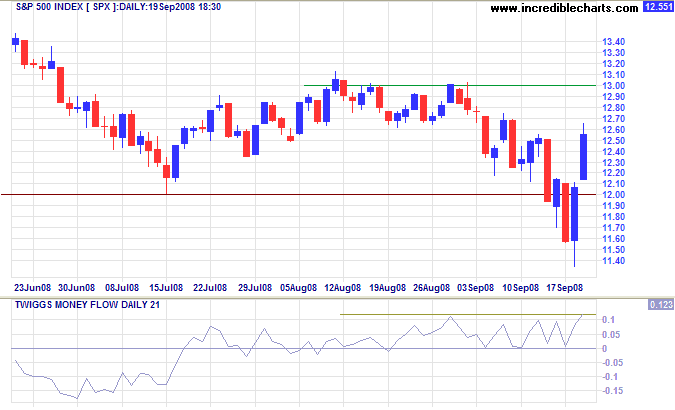
The S&P 500 recovered above 1200 and is headed for a test of resistance at 1300. Twiggs Money Flow (21-day) holding above zero signals buying pressure, but this is likely to be shorts covering their positions on financial stocks. Recovery above 1300, while unlikely, would indicate a primary trend reversal; but wait for confirmation from the Dow and 13-week Twiggs Money Flow. Volatile markets tend to give many false signals.
Transport
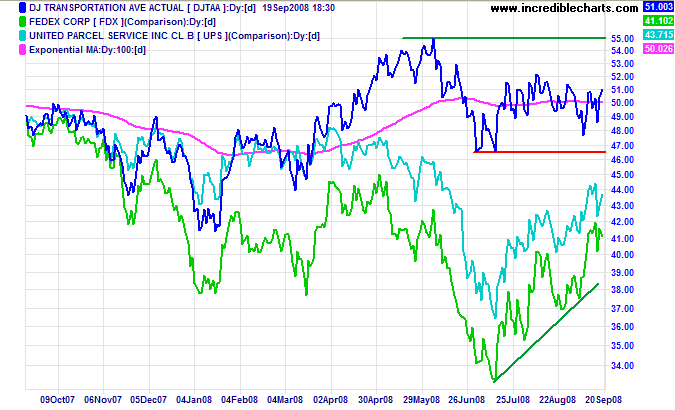
Fedex and UPS continue in primary up-trends, with oil prices falling, but the overall Dow Transport Average shows hesitancy as consumer spending slows.
Small Caps
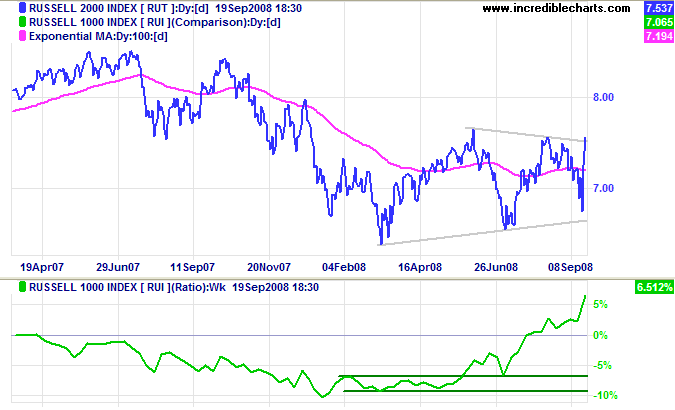
The Russell 2000 Small Caps index broke out above its large triangle: an early indication of a primary up-trend. The index continues to out-perform the large cap Russell 1000, with the price ratio rising. Large cap financial stocks have suffered more from the on-going crisis than their small cap counterparts.
Technology
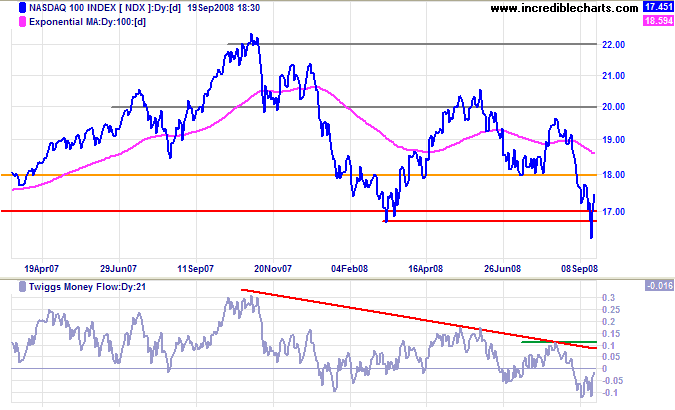
The Nasdaq 100 recovered quickly after dipping below support at 1700, warning of a possible bear trap. Twiggs Money Flow (13-week) displays a bullish divergence, but this still has to be confirmed by the 21-day index rising above its August high. Reversal below 1700, while less likely, would signal a down-swing with a target of 1400. Calculated as 1700 - ( 2000 - 1700 ).
Canada: TSX
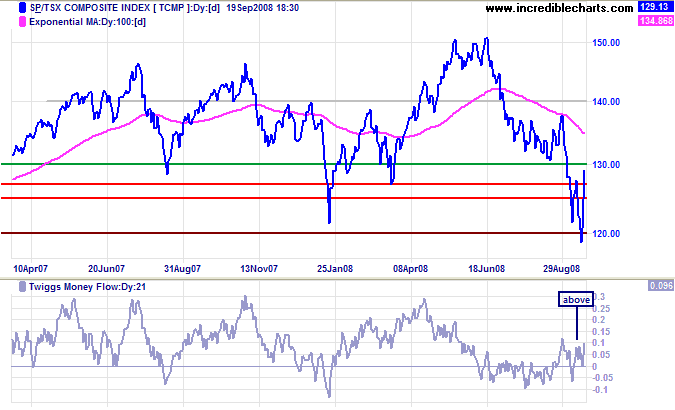
The TSX Composite is testing resistance at 13000, after a sharp recovery from support at 12000. Breakout above 13000 would test 14000, but the index remains in a primary down-trend and another test of 12000 remains more likely. Twiggs Money Flow (21-day) holding above zero signals short-term buying pressure only.
United Kingdom: FTSE
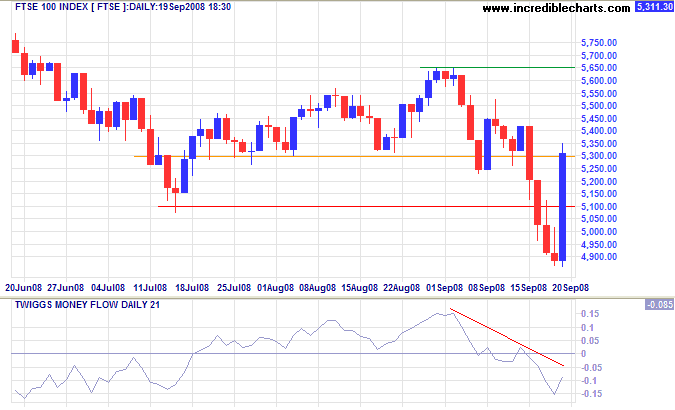
Despite massive gains on Friday, most likely due to covering by shorts, the FTSE 100 remains in a primary down-trend. Twiggs Money Flow (21-day) continues to signal selling pressure. Recovery above 5650 remains unlikely; while reversal below 5100 would signal another primary down-swing, with a target of 4800, the low of April 2005.
Europe: DAX
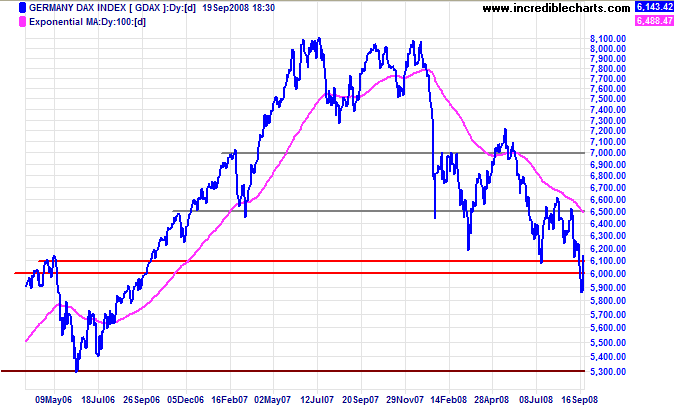
The DAX made a similar recovery above 6100, but the primary trend remains down. Breakout above 6500 is unlikely; while reversal below 6000 would signal another down-swing — with a target of 5300.
India: Sensex
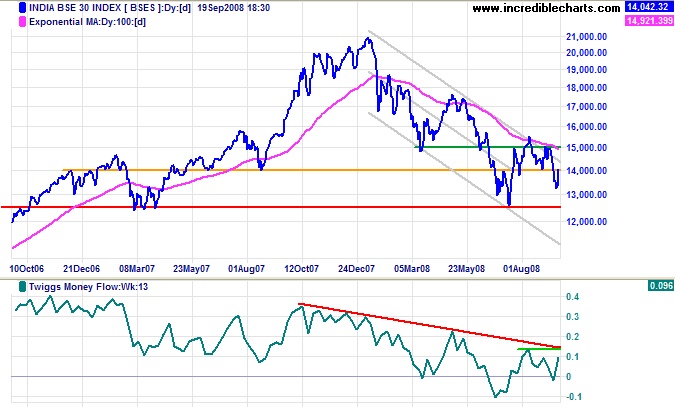
The Sensex recovered sharply after breaking through support at 14000 — and is likely to test the upper trend channel. The primary trend remains down and we can expect another test of 12500. Twiggs Money Flow (13-week), however, threatens a bullish divergence if the indicator breaks above its August high of 0.14; breakout above 15000 would strengthen the signal.
Japan: Nikkei
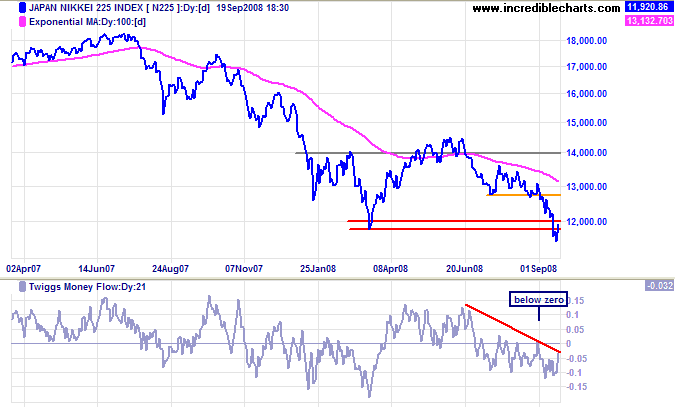
The Nikkei 225 broke through support at 12000/11800 and is now retracing to test the new resistance level. The signal offers a target of 10000, calculated as 12000 - (14000 - 12000). Twiggs Money Flow below zero signals continued selling pressure.
China
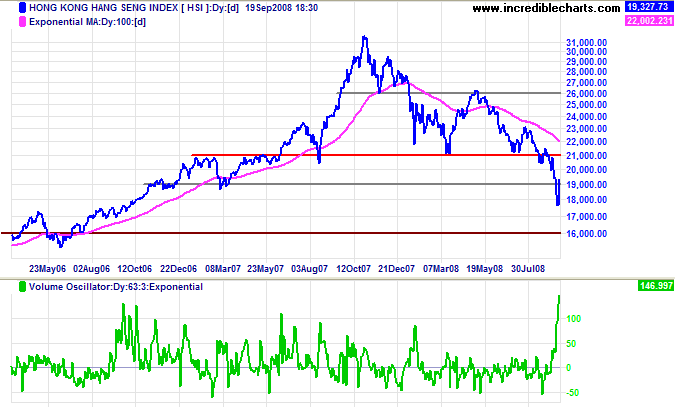
The Hang Seng recovered above 19000, with massive volume signaling strong support. Expect a test of 21000, but the primary trend is down — and the long-term target of 16000 remains. Calculated as 21000 - ( 26000 - 21000 ). Twiggs Money Flow (21-day) continues to signal selling pressure.
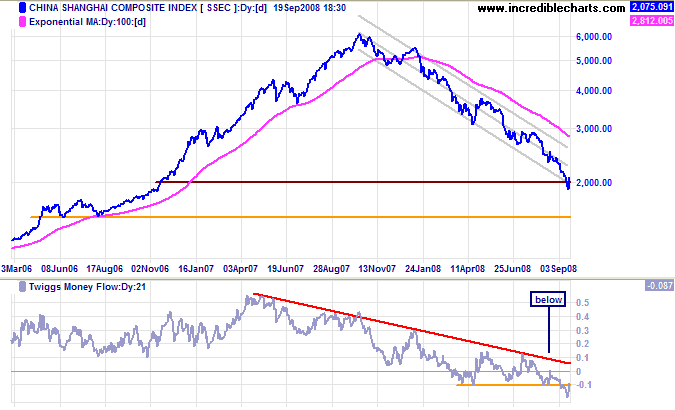
The Shanghai Composite recovered above 2000 and we can expect a medium-term rally. But the primary trend remains down — with a target of 1500. Twiggs Money Flow (21-day) below zero and trending downwards signals strong selling pressure.
Australia: ASX
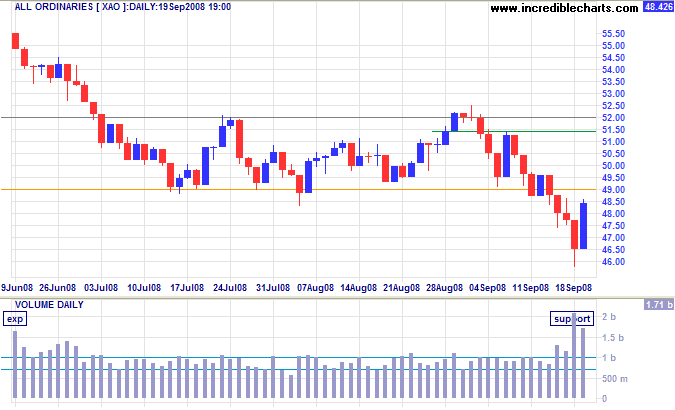
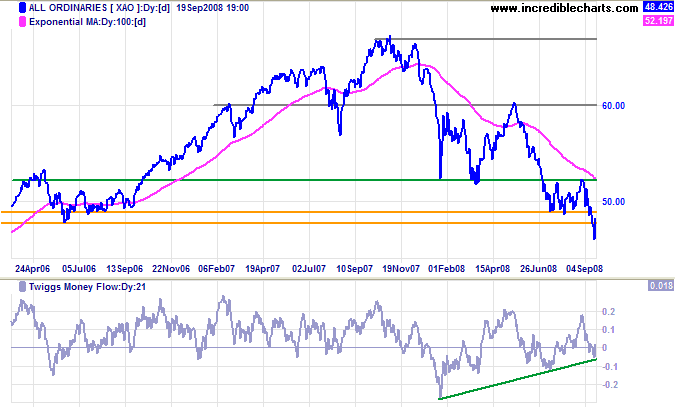
The All Ordinaries is likely to break 4900, on the back of strong Friday closes in US and UK markets. Large volumes indicate buying support, but resistance at 5200 is likely to hold. Subsequent reversal below 4900 would confirm the down-swing — with a target of 4300, the October 2005 low.
Long Term: We remain in a bear market. A Twiggs Money Flow (21-day) rise above the early September high of 0.17 would complete a bullish divergence. But this is not confirmed by the 13-week indicator and would be limited to a secondary rally.
Throughout all my years of investing I've found that the big money was never made in the buying or the selling.
The big money was made in the waiting.
~
Jesse Livermore

Author: Colin Twiggs is a former investment banker with almost 40 years of experience in financial markets. He co-founded Incredible Charts and writes the popular Trading Diary and Patient Investor newsletters.
Using a top-down approach, Colin identifies key macro trends in the global economy before evaluating selected opportunities using a combination of fundamental and technical analysis.
Focusing on interest rates and financial market liquidity as primary drivers of the economic cycle, he warned of the 2008/2009 and 2020 bear markets well ahead of actual events.
He founded PVT Capital (AFSL No. 546090) in May 2023, which offers investment strategy and advice to wholesale clients.
