Hang Seng Shines
By Colin Twiggs
August 28, 3:00 a.m. ET (5:00 p.m. AET)
These extracts from my trading diary are for educational purposes and should not be interpreted as investment or trading advice. Full terms and conditions can be found at Terms of Use.
I will be away this weekend and have combined the normal yields & spreads (Thursday) and stock markets (Saturday) newsletters into one.
Overview
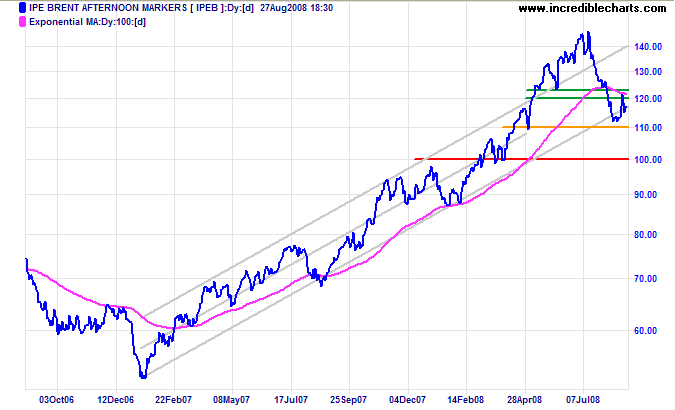
Crude oil respected support at $110 and is headed for another test of resistance between $120 and $122 per barrel. Failure of support (and breakout from the trend channel) would warn of a primary down-trend — confirmed if key psycholgical support at $100 is penetrated. Breakout above $122 remains less likely — and would signal another test of $150.
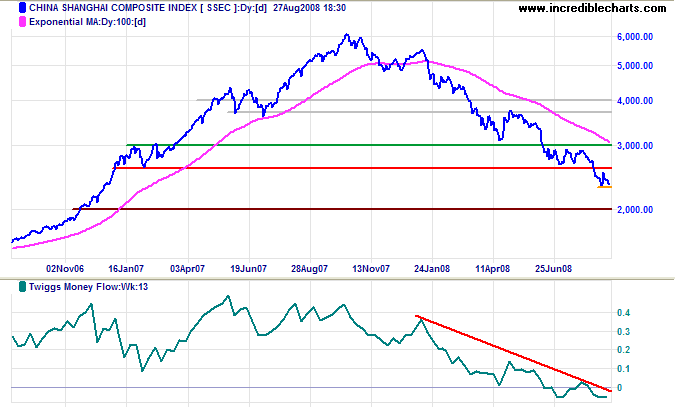
With the Shanghai index having fallen more than 60 percent from its 2007 peak, the probability of a slow-down of Chinese consumption is increasing — which would cause a primary down-trend in crude oil prices.
The spike in crude oil prices over the last year hurt the Transport and Automotive industries, but the biggest impact on the stock market has been the collapse of the housing market, damaging the Financial sector and Construction. The latest Case Schiller index shows housing prices continue to fall.
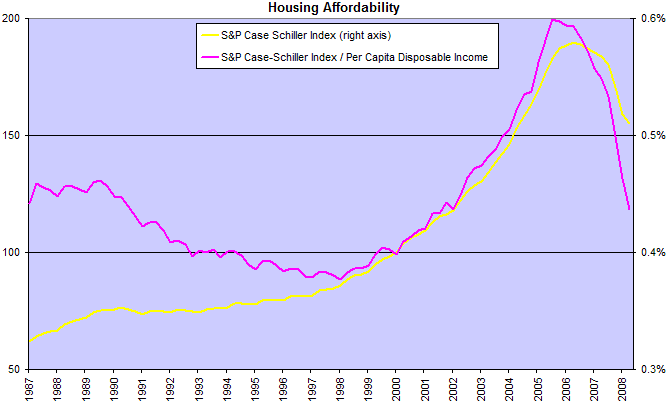
Housing affordability, measured by dividing the housing index by per capita disposable income, is rapidly improving — approaching its 1998 lows. But there are two factors that will delay a housing bottom:
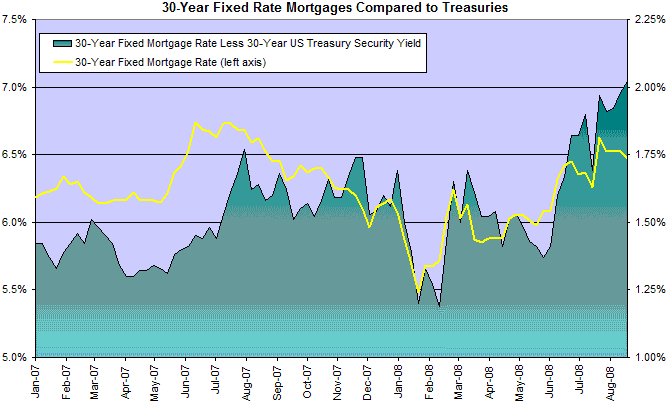
- The spread between home mortgage rates and long-term treasury bonds is widening as banks and agencies attempt to repair their balance sheets — forcing mortgage rates higher and deterring home buyers.
- Expectations of further falls in the housing index will cause potential purchasers to delay buying until there are clear signs of a bottom. This becomes a self-fulfilling expectation — in the same way that rising prices attracted buyers like moths to a flame.
USA
Dow Jones Industrial Average
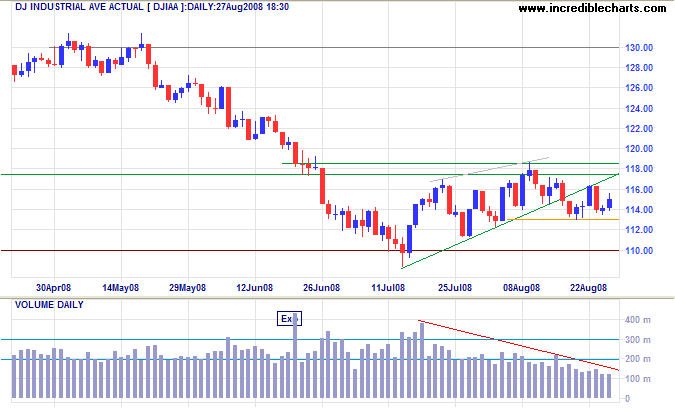
The Dow found support at 11300. Failure would indicate a test of primary support at 11000, while recovery above 11600 would signal continuation of the secondary rally. Volumes are typically low in the last week in August (thank you Kate for pointing this out), but this year have declined more than usual. Expect the consolidation to continue or edge slowly higher — before a sharp fall.
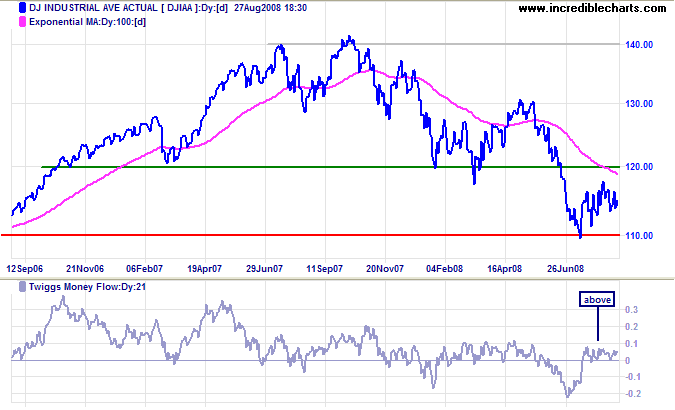
Long Term: Twiggs Money Flow holding above the zero line signals short/medium-term buying pressure, typical of a secondary rally. But the primary trend remains downward and the rally is unlikely to break resistance at 12000.
S&P 500
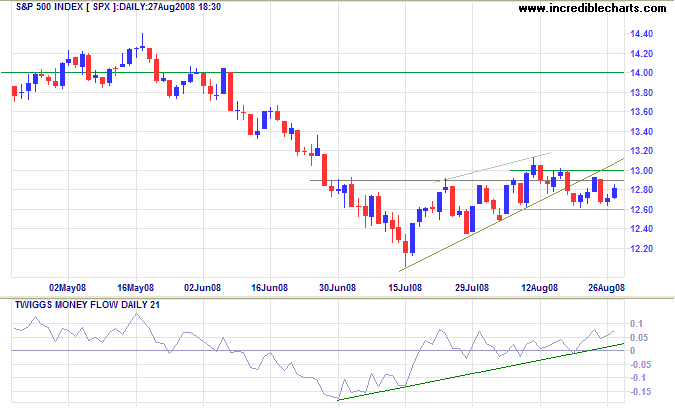
The S&P 500 shows similar short/medium-term buying pressure on Twiggs Money Flow, with the index headed for a test of 1300. The primary trend, however, remains downward.
Yields & Rates
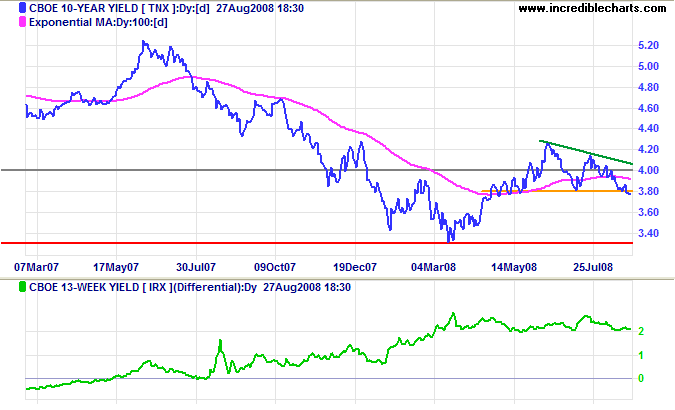
Ten-year treasury yields have broken below support at 3.80 percent, signaling a test of primary support at 3.30 percent. Falling treasury yields indicate investors seeking security, rather than a decline in inflation expectations.
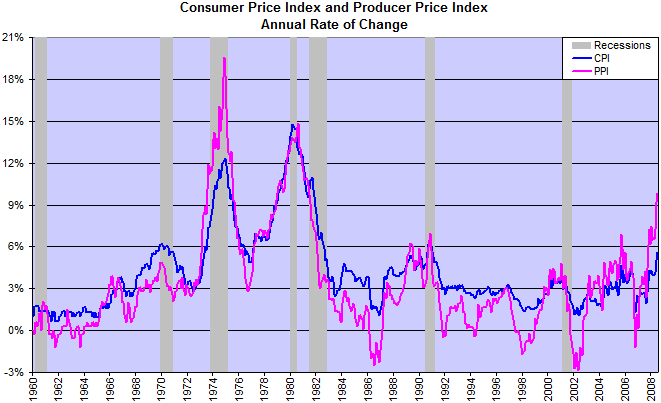
The Producer Price Index is leading and the Consumer Price Index is likely to follow.
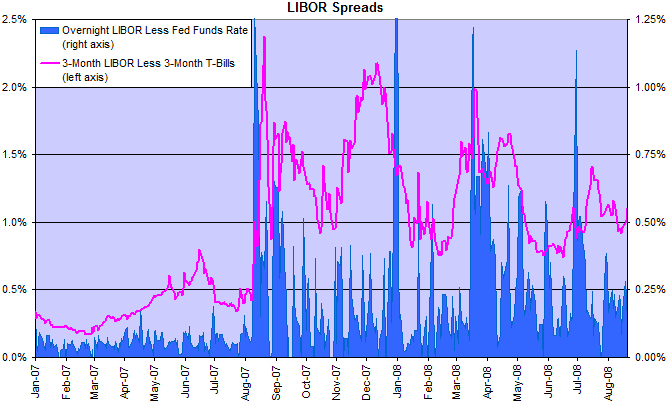
The differential between the fed funds rate and 3-month T-bills is relatively low, projecting a stable market. But spreads between 3-month LIBOR and treasury bills remain elevated. Inter-bank lending continues to demand a substantial premium over treasury rates, indicating concerns over bank failure remain high.
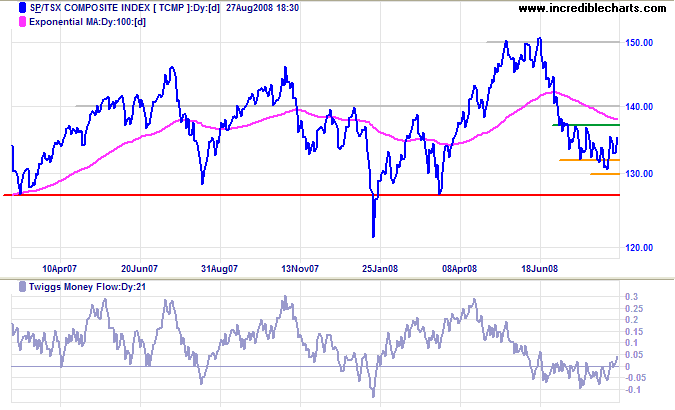
Canada: TSX
Twiggs Money Flow (21-day) broke above the zero line, indicating buying pressure. Expect a secondary rally to test resistance at 14000.
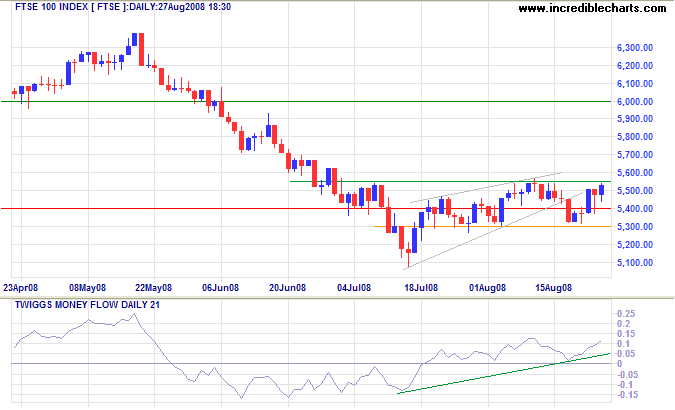
United Kingdom: FTSE
The FTSE 100 is testing medium-term support at 5550. Rising Twiggs Money Flow indicates that a breakout is likely. Expect a secondary rally to test 6000. But the primary trend remains downward.
Germany: Dax
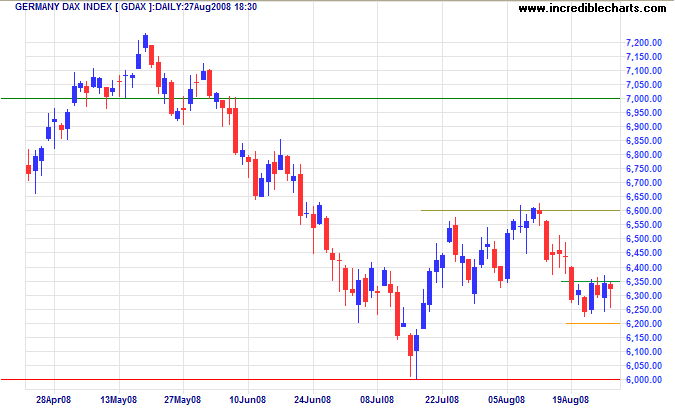
The Dax consolidated between 6350 and 6200 over the past week. Failure of 6200 would test primary support at 6000, while breakout above 6350 would signal another test of 6600.
India: Sensex
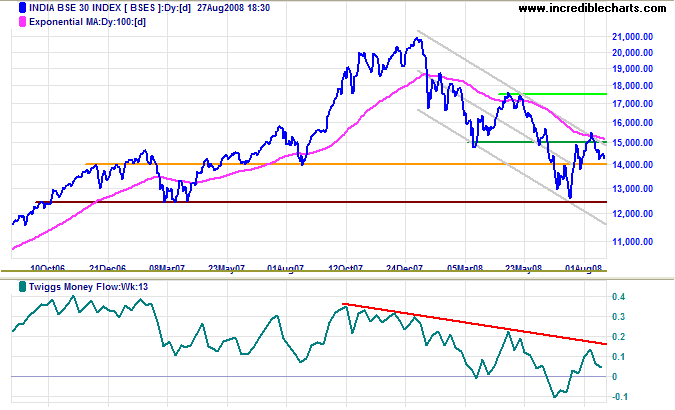
The Sensex continues to test 14000. Failure of support would mean another test of 12500. Twiggs Money Flow signals short-term buying but long-term selling pressure. The primary trend remains down and failure of 12500 would warn of another primary decline. Recovery above 15000 (and breakout from the trend channel), on the other hand, would indicate that the down-trend is weakening.
Japan: Nikkei
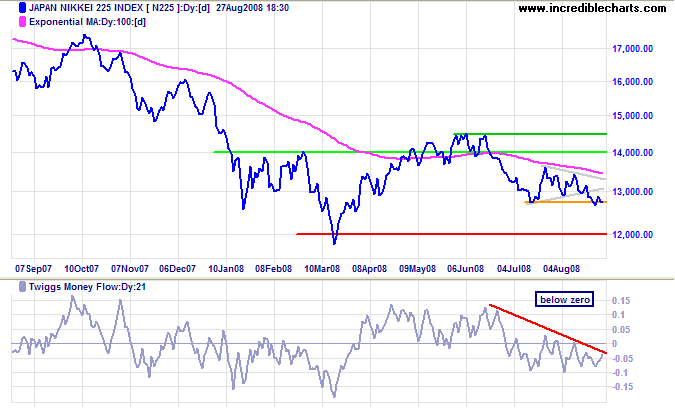
The Nikkei 225 is headed for a test of primary support at 12000. Twiggs Money Flow holding below zero signals selling pressure. In the long term, failure of support at 12000 would offer a target of 10000.
China
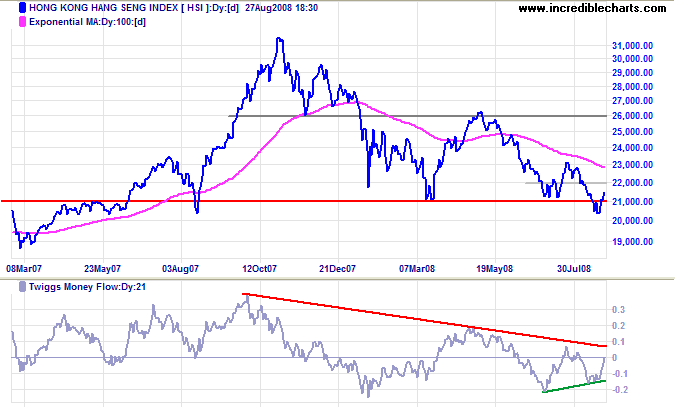
The Hang Seng shows greater resilience than the Shanghai index. After a failed break below 21000, the index recovered and is headed for a test of 22000. Breakout above 22000 would confirm the bear trap — signaling a test of 26000. Twiggs Money Flow crossing above zero would signal (short-term) buying pressure and a rise above its July high would confirm the up-trend.
Australia: ASX
The All Ordinaries broke through resistance at 5100, signaling a secondary rally. Twiggs Money Flow, rising strongly above zero, confirms. Reversal below 4900 is now unlikely.
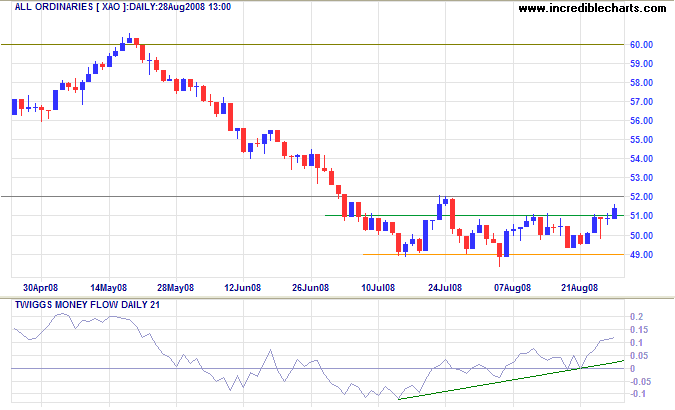
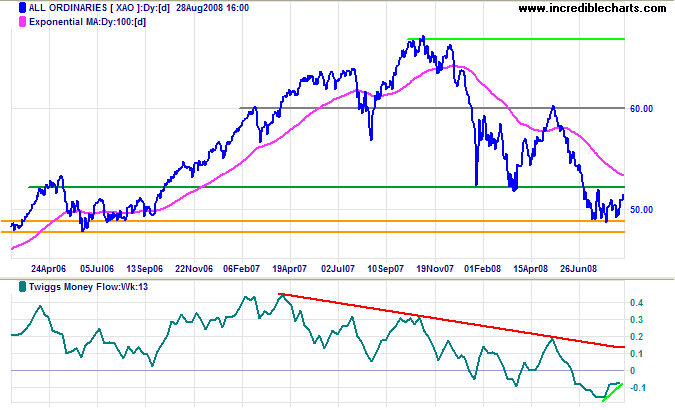
Long Term: The primary trend, however, remains down.
I find it fascinating that most people plan their vacations
with better care than they plan their lives.
Perhaps that is because escape is easier than change.
~ Jim Rohn
To understand my approach, please read About The Trading Diary.

Author: Colin Twiggs is a former investment banker with almost 40 years of experience in financial markets. He co-founded Incredible Charts and writes the popular Trading Diary and Patient Investor newsletters.
Using a top-down approach, Colin identifies key macro trends in the global economy before evaluating selected opportunities using a combination of fundamental and technical analysis.
Focusing on interest rates and financial market liquidity as primary drivers of the economic cycle, he warned of the 2008/2009 and 2020 bear markets well ahead of actual events.
He founded PVT Capital (AFSL No. 546090) in May 2023, which offers investment strategy and advice to wholesale clients.
