Oil & Housing
By Colin Twiggs
August 23, 4:00 a.m. ET (6:00 p.m. AET)
These extracts from my trading diary are for educational purposes and should not be interpreted as investment or trading advice. Full terms and conditions can be found at Terms of Use.
Overview
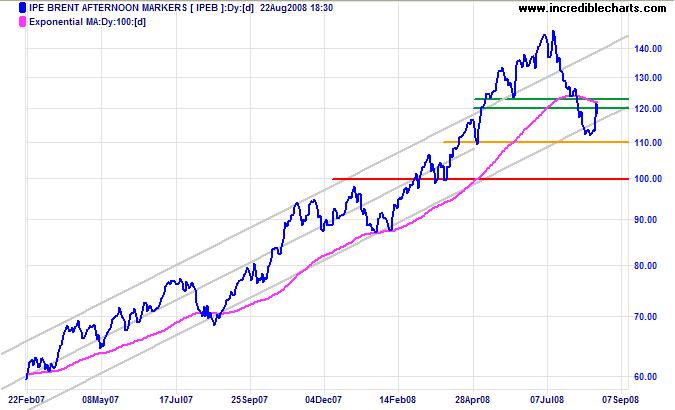
The crude oil rally encountered resistance at $120/$122 per barrel. Expect sellers to force another test of support at $110. A fall below $110 would signify a clear breakout from the trend channel, warning of a primary trend reversal. And penetration of the key psychological barrier of $100 would confirm.
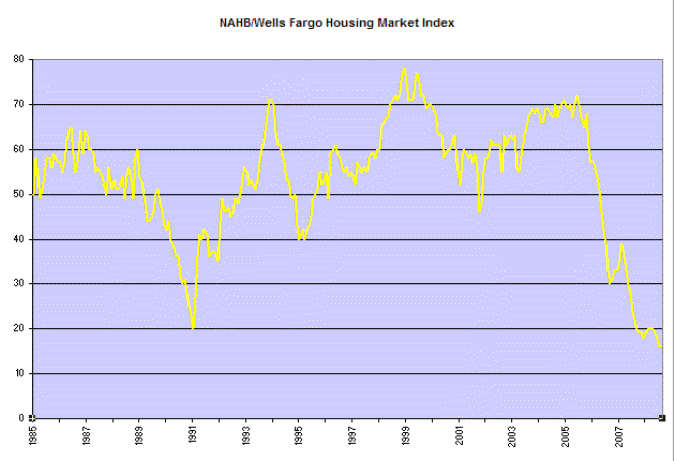
The bear market in stocks is unlikely to end, however, even if we see a primary trend change in crude oil. Not until there is a clear bottom in the housing market.
USA
Dow Jones Industrial Average
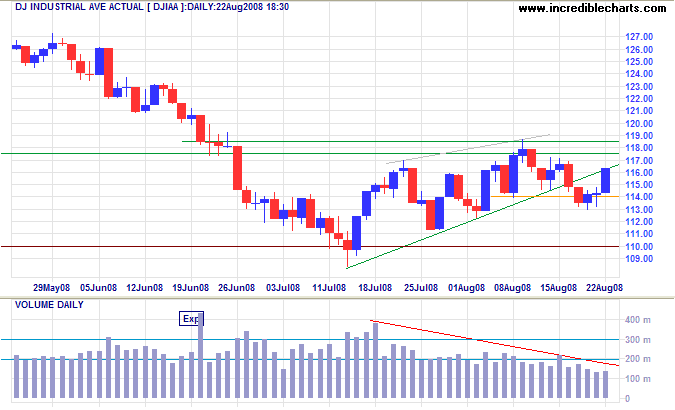
The Dow is headed for another test of the band of resistance between 11750 and 11850. Low volume indicates that resistance is likely to hold — followed by a further test of 11000.
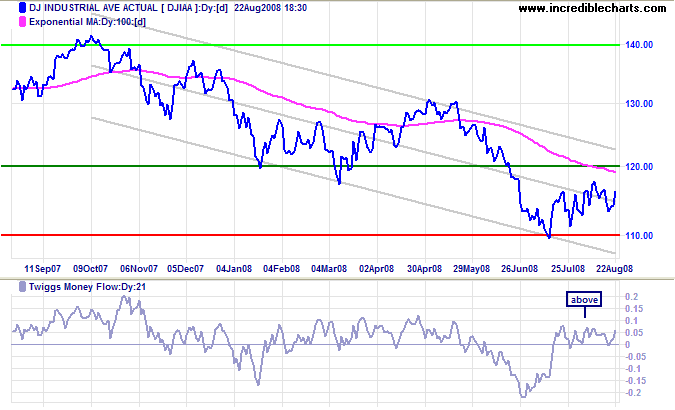
Long Term: Twiggs Money Flow (21-day) action is typical of a secondary rally: oscillating just above the zero line. In the medium term, expect a test of resistance at 12000 and the upper trend channel. Long term, we remain in a bear market. And penetration of support at 11000 would offer a target of 10000.
S&P 500
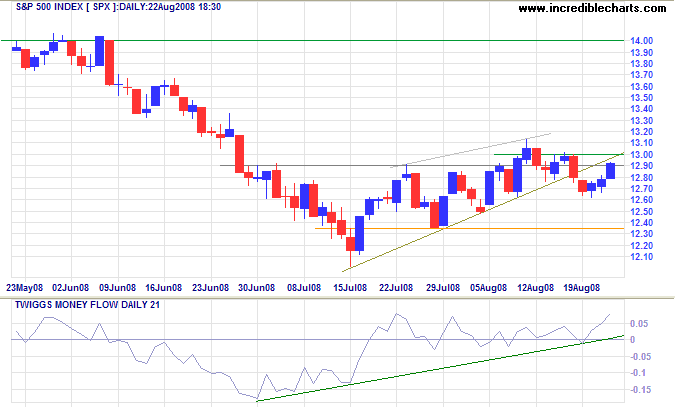
The S&P 500 completed a bearish rising wedge pattern (thanks to John for identifying this). But there was no confirming surge of volume at the breakout; and the index headed for another test of resistance at 13000. Twiggs Money Flow (21-day) displays similar buying pressure to the Dow. Expect the secondary rally to continue.
Transport
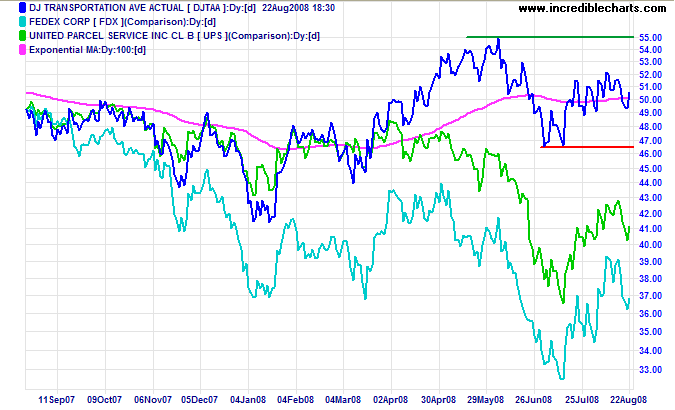
The Dow Transport Average is inversely tracking the fortunes of crude oil. A (crude) primary trend reversal would see transport stocks soar. Fedex and UPS remain in a primary down-trend for the present.
Small Caps
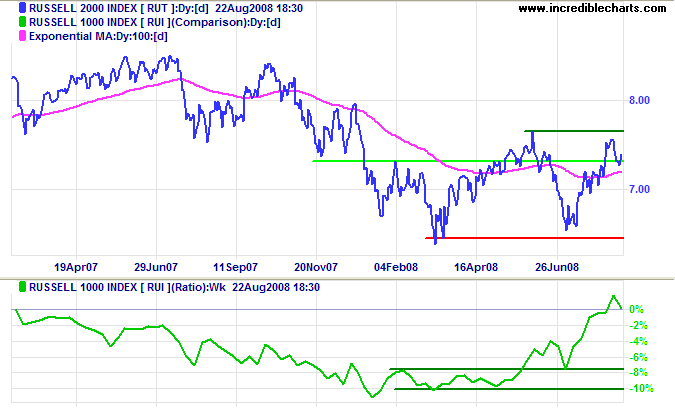
The Russell 2000 Small Caps index are out-performing the large cap Russell 1000. I repeat the three possible reasons mentioned last week:
- institutional holdings and margin trading are concentrated in large cap stocks leaving small caps relatively untouched by the liquidity crisis;
- short sales are concentrated in larger cap stocks; and
- falling energy stocks have greater representation in the Russell 1000.
Technology
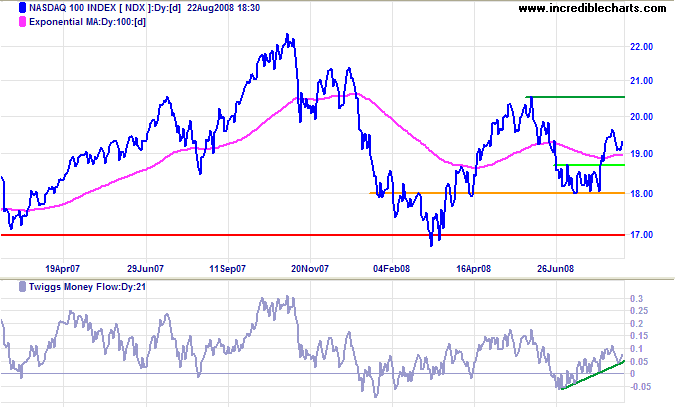
The Nasdaq 100 shows strong (medium-term) buying pressure on Twiggs Money Flow (21-day). The index is headed for a test of resistance at 2050. Breakout would indicate the start of a primary up-trend.
Canada: TSX
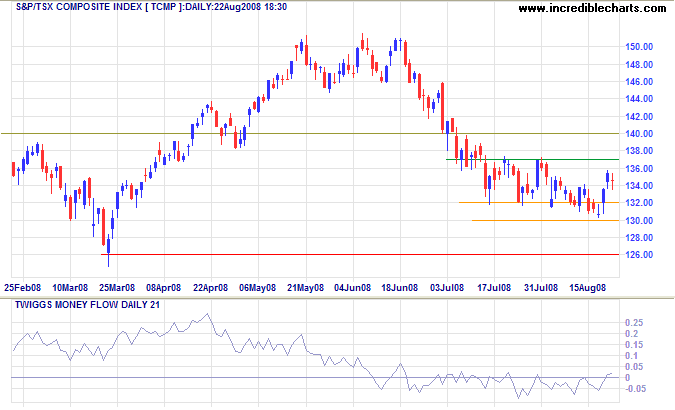
The TSX Composite rallied after finding further support at 13000, but Twiggs Money Flow (21-day) continues to oscillate below zero, indicating selling pressure. Expect reversal below 13000 and a test of primary support at 12600.
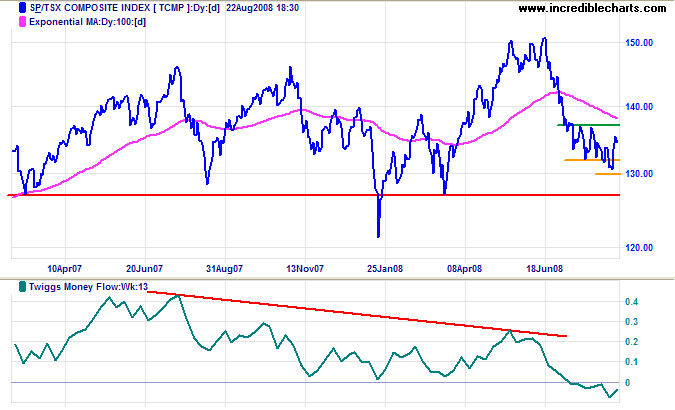
Twiggs Money Flow (13-week) declining below previous 2007/2008 troughs indicates that primary support at 12600 is unlikely to hold — which would signal the start of a primary down-trend.
United Kingdom: FTSE
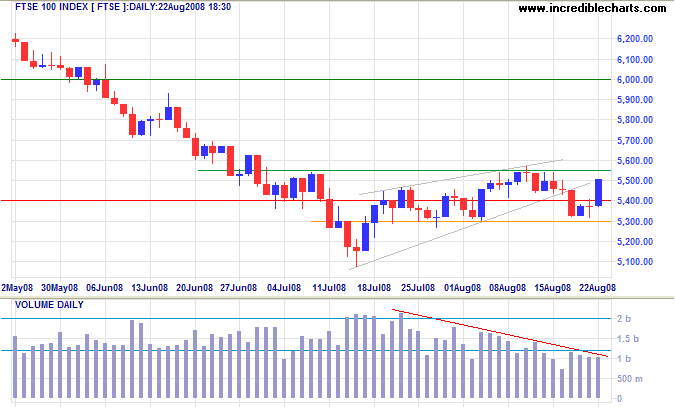
The FTSE 100 rallied off support at 5300 and is headed for a test of resistance at 5550. Breakout would signal a test of 6000, but declining volumes suggest the index is unlikely to reach this target.
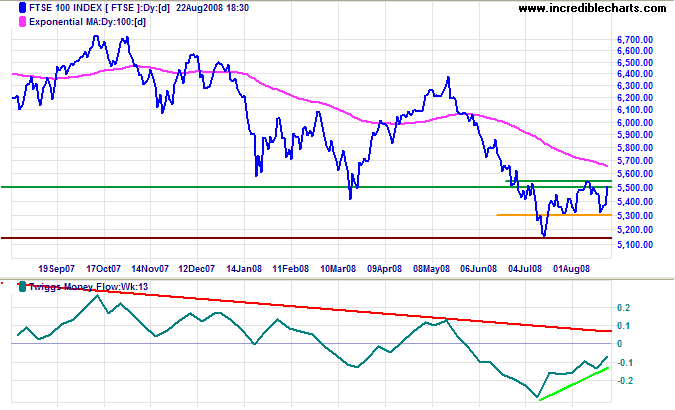
Twiggs Money Flow (13-week) shows a secondary rally, but the primary signal remains bearish. Reversal below 5300 would indicate another primary down-swing, with a target of 4300.
Europe: DAX
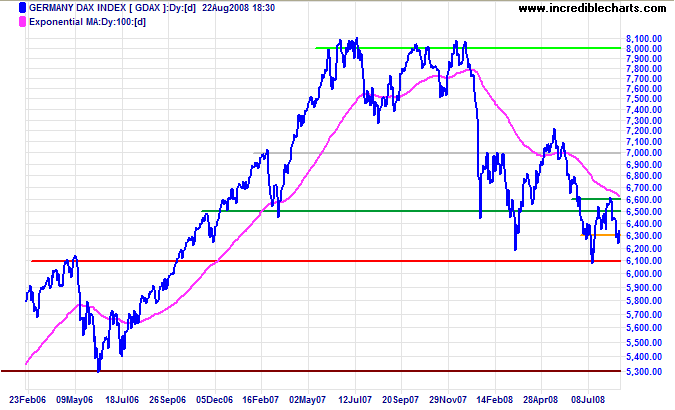
The German Dax made a failed break below 6300 and is now headed for a test of resistance at 6500/6600. Reversal below 6300 would warn of another primary down-swing, with a target of 5300 (the June 2006 low).
India: Sensex
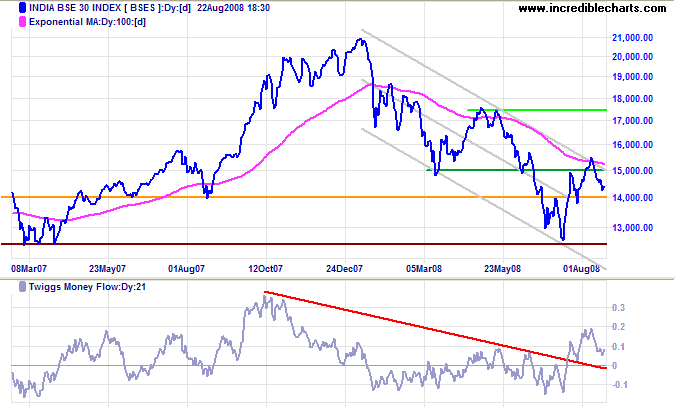
The Sensex is headed for a test of support at 14000. Failure of support, or Twiggs Money Flow (21-day) reversal below zero, would warn of a test of primary support at 12500.
Japan: Nikkei
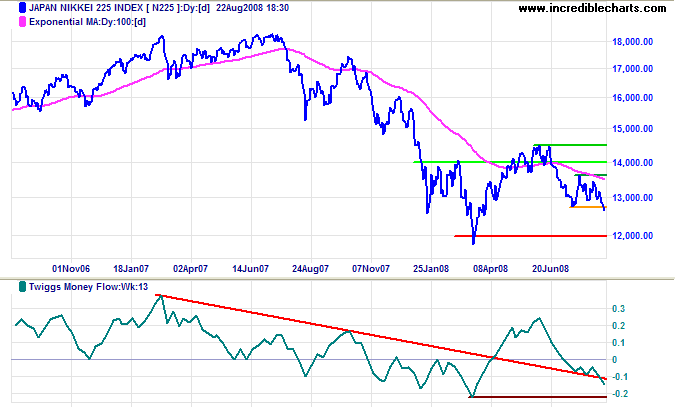
The Nikkei 225 breakout below 12900 signals a test of primary support at 12000/11800. Twiggs Money Flow (13-week) below its March low would warn that primary support is likely to fail. Failure of primary support would offer a target of 10000; calculated as 12000 - (14000 - 12000).
China
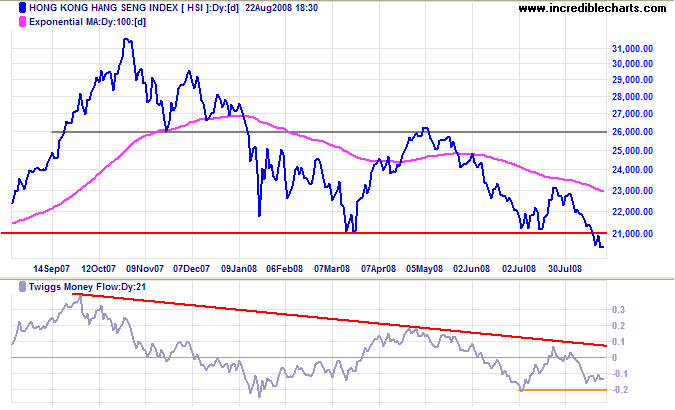
The Hang Seng broke through primary support at 21000, a brief retracement confirming the new resistance level. The breakout offers a target of 16000, calculated as 21000 - (26000 - 21000). Twiggs Money Flow (21-day) fall below its July low would confirm the signal. Recovery above 21000 is now unlikely, but would warn of a bear trap.
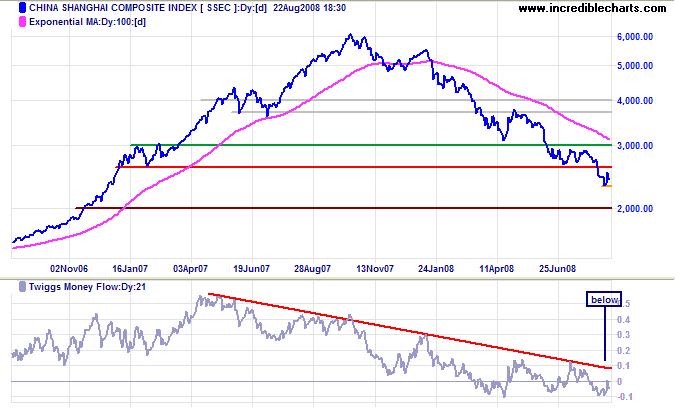
The Shanghai Composite found short-term support at 2300. Failure of this level would confirm the medium-term target of 2000. Twiggs Money Flow (13-week) respecting the zero line from below indicates selling pressure. Recovery above 2600 is unlikely — and would test resistance at 3000.
Australia: ASX
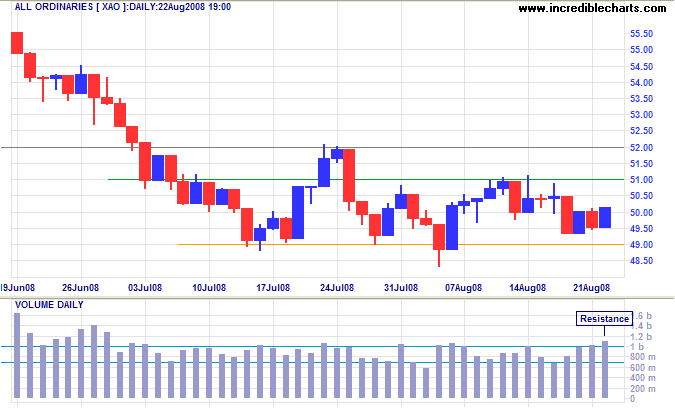
The All Ordinaries continues to consolidate between 4900 and 5100. Rising volume indicates strong selling into the latest rally. Breakout above 5100 would signal another bear market rally, but reversal below 4900 is more likely.
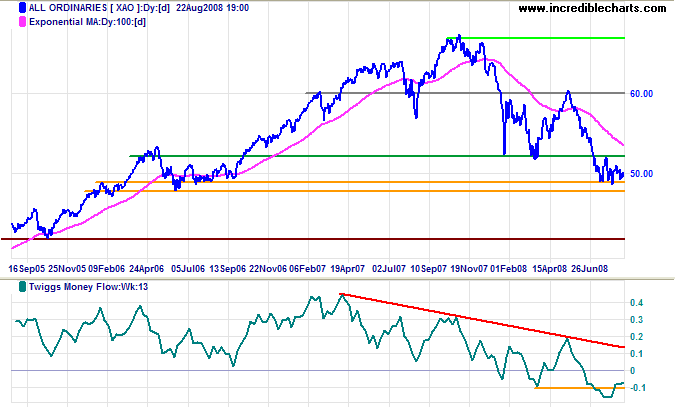
Long Term: Declining 13-week Twiggs Money Flow warns that we are in the middle of a bear market. Failure of support at 4900/4800 remains likely — and would offer a target of 4300 (the October 2005 low).
But man, proud man,
Drest in a little brief authority,
Most ignorant of what he's most assured,
His glassy essence, like an angry ape,
Plays such fantastic tricks before high heaven
As make the angels weep.
~ William Shakespeare:
Measure for Measure, Act II Scene 2
To understand my approach, please read About The Trading Diary.

Author: Colin Twiggs is a former investment banker with almost 40 years of experience in financial markets. He co-founded Incredible Charts and writes the popular Trading Diary and Patient Investor newsletters.
Using a top-down approach, Colin identifies key macro trends in the global economy before evaluating selected opportunities using a combination of fundamental and technical analysis.
Focusing on interest rates and financial market liquidity as primary drivers of the economic cycle, he warned of the 2008/2009 and 2020 bear markets well ahead of actual events.
He founded PVT Capital (AFSL No. 546090) in May 2023, which offers investment strategy and advice to wholesale clients.
