Short-Term Gain, Long-Term Pain
By Colin Twiggs
August 2, 3:00 a.m. ET (5:00 p.m. AET)
These extracts from my trading diary are for educational purposes and should not be interpreted as investment or trading advice. Full terms and conditions can be found at Terms of Use.
Overview
Stock markets generally show short-term accumulation, signaling continuation of the bear market rally, but long-term signals, with the exception of China and India, remain negative — warning that the bear market is far from over.
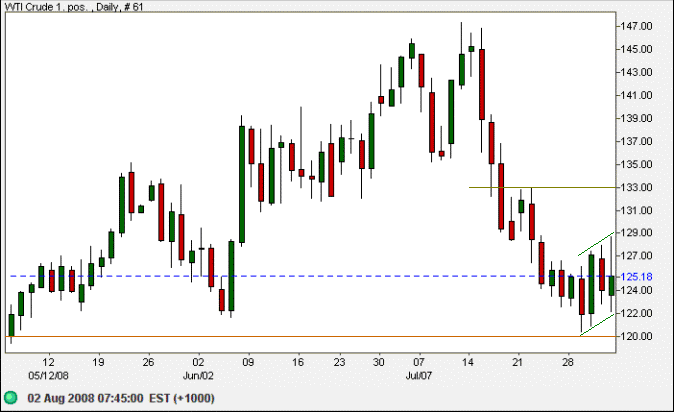
Crude oil is edging higher after successfully testing support at $120/barrel. Expect another retracement to test the support level. Failure would warn of a test of $110, while WTI recovery above $133 would signal the correction has ended — and the start of another primary advance.
USA
Dow Jones Industrial Average
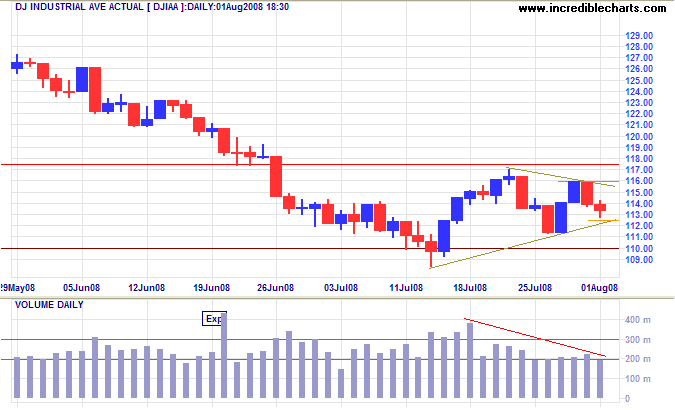
The Dow formed a small triangle, with declining volume typical of a consolidation. Recovery above 11600 would signal continuation of the bear market rally, while reversal below 11250 would warn of continuation of the primary decline.
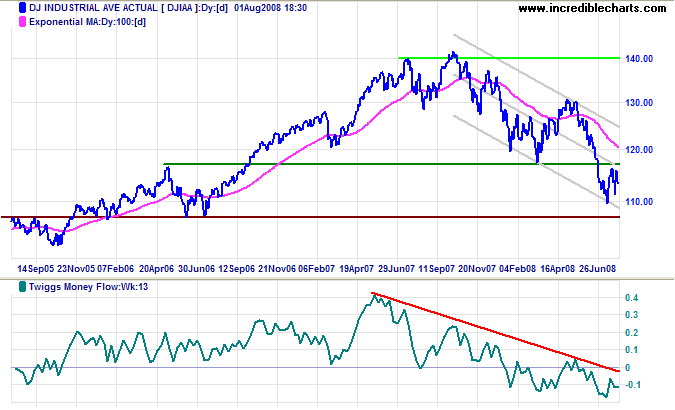
Long Term: Twiggs Money Flow (21-day) above zero signals that the rally is likely to continue, but the 13-week indicator warns that we are still in a bear market. Failure of support at 11000 would signal another down-swing, with a target of 10700 (the June 2006 low). If 10700 was to fail, the next major support band is 10000/9700.
S&P 500
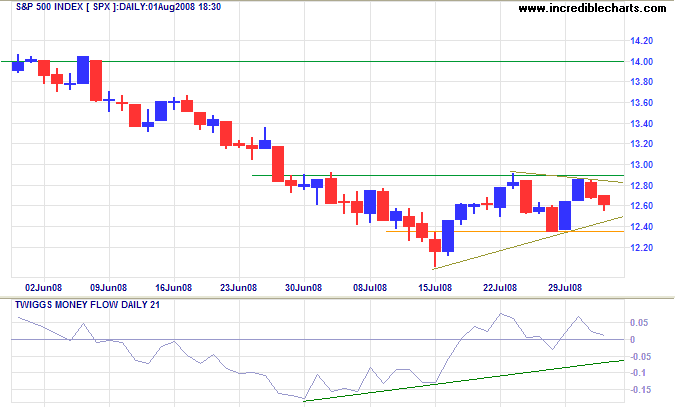
The S&P 500 displays a similar triangle to the Dow, while 21-day Twiggs Money Flow holding above zero favors continuation of the bear market rally. Longer term Twiggs Money Flow remains bleak, however, and our target remains 1120 [1270-(1420-1270)].
Transport
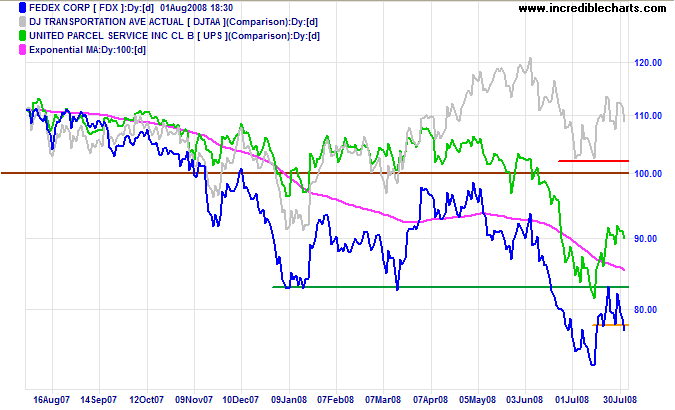
Fedex respected resistance at $83.00, signaling another primary down-swing. The transport average is expected to follow — with negative implications for the broader economy. Only a sharp fall in crude oil prices would be likely to slow the decline.
Small Caps
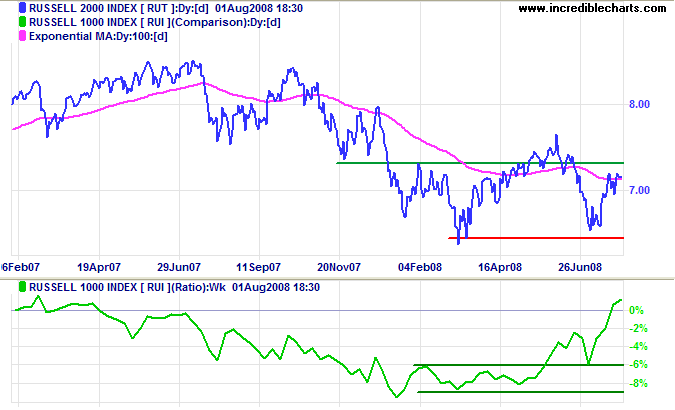
The Russell 2000 Small Caps index continues to be favored over the large cap Russell 1000. The only explanation I can come up with for this "high risk" behavior is that institutional holdings and margin trading are concentrated in large cap stocks, leaving small caps relatively untouched by the liquidity crisis.
Technology
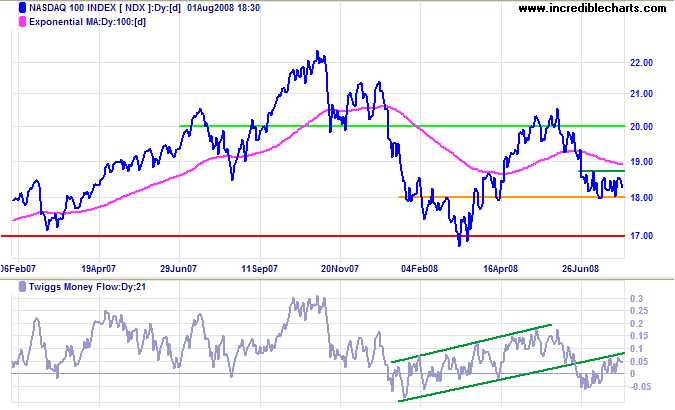
The Nasdaq 100 is consolidating between 1800 and 1870. Again, 21-day Twiggs Money Flow holding above zero indicates buying pressure but the 13-week indicator signals a bear market. Upward breakout from the consolidation would offer a target of 2000, while reversal below 1800 would test primary support at 1700.
Canada: TSX
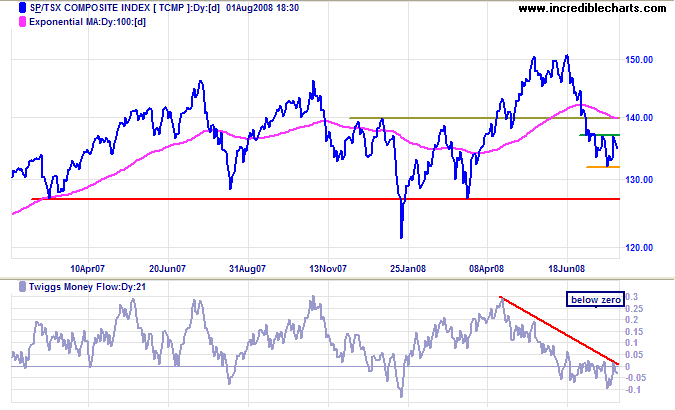
The TSX Composite is consolidating above 13200. Both long- and short-term Twiggs Money Flow support the continuation signal, warning of a downward breakout and test of primary support at 12700/12600.
United Kingdom: FTSE
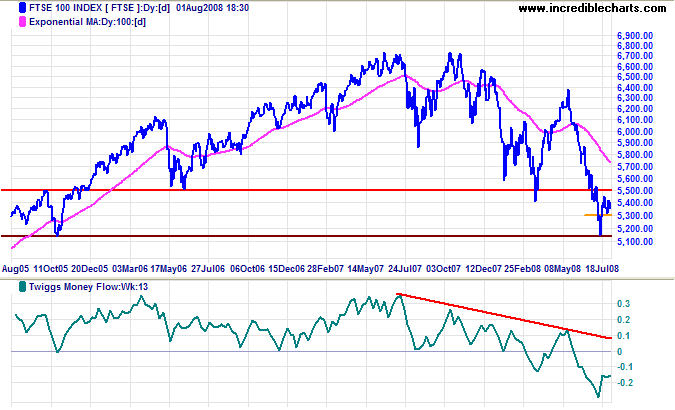
The FTSE 100 is consolidating between 5300 and 5450. Declining 13-week Twiggs Money Flow indicates a strong bear market, but the 21-day indicator holding above zero reveals short-term buying pressure. Breakout above 5500 would signal continuation of the bear rally, while reversal below 5300 would warn of another primary down-swing — with a target of 4300.
Europe: DAX
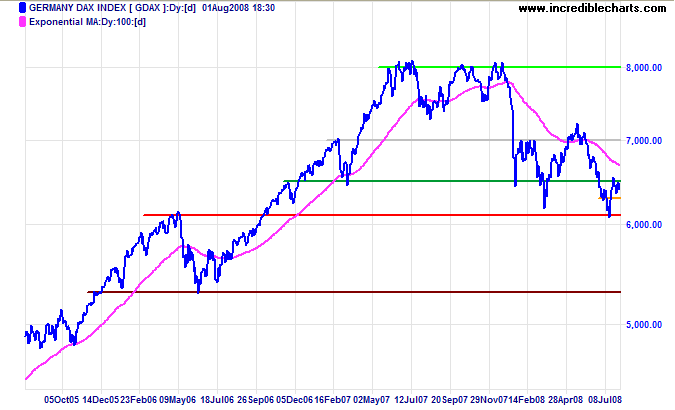
The German Dax is consolidating in a narrow band below resistance at 6500, indicating an upward breakout — with a target of 7000. Reversal below 6350, however, would warn of another primary down-swing, with a target of 5300 (the June 2006 low).
India: Sensex
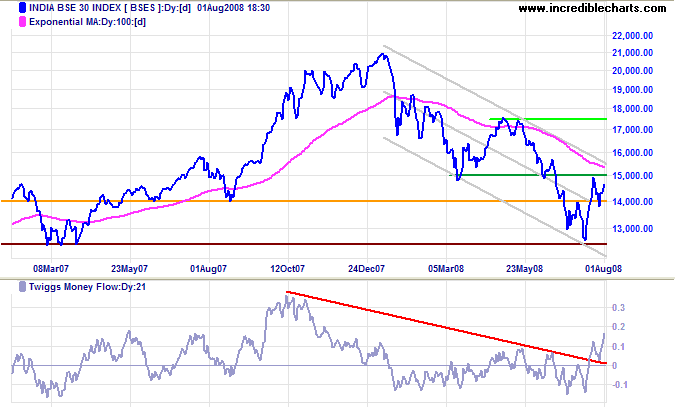
The Sensex is headed for another test of resistance at 15000. Twiggs Money Flow (21-day) above zero and rising sharply indicates that an upward breakout is likely — offering a target of 17500 and signaling that the primary down-trend is weakening. Reversal below 14000, however, would warn of another test of primary support at 12500.
Japan: Nikkei
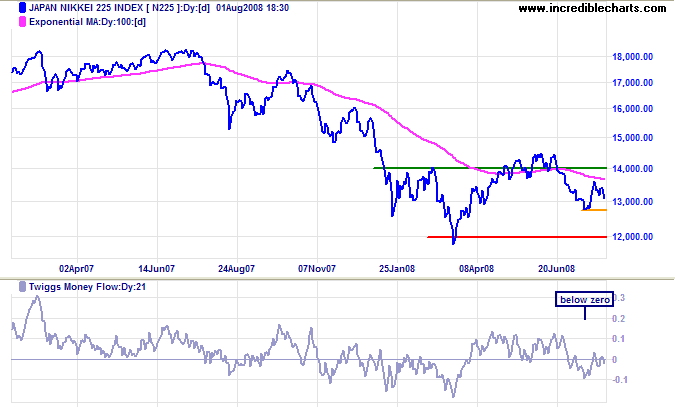
The Nikkei 225 is headed for another test of support at 12700. Twiggs Money Flow (21-day) holding below zero warns that support is likely to fail — and test primary support at 12000. Respect of 13000, while not expected, would suggest another test of 14500.
China
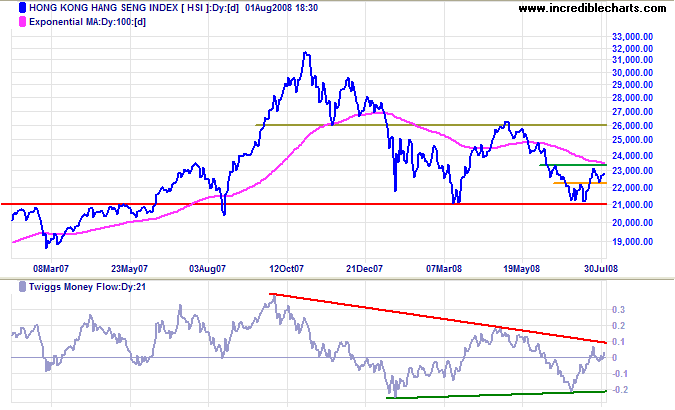
The Hang Seng is headed for another test of resistance at 23400. Breakout would offer a target of 26400 and warn that the primary down-trend is weakening. Twiggs Money Flow (21-day) holding above zero indicates buying pressure. In the longer term, penetration of 26400 would complete a double bottom reversal, while failure of 21000 would offer a target of 16000 [21000-(26000-21000)].
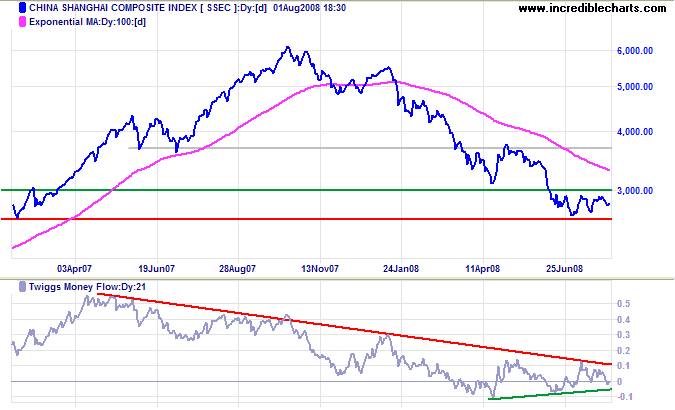
The Shanghai Composite continues to consolidate between 2600 and 3000. Reversal below 2600 would warn of a primary down-swing, with a target of 2000; while recovery above 3000 would offer a target of 3700. Twiggs Money Flow (21-day) holding above zero suggests an upward breakout; a rise above the descending trendline would indicate that the primary trend has weakened.
Australia: ASX
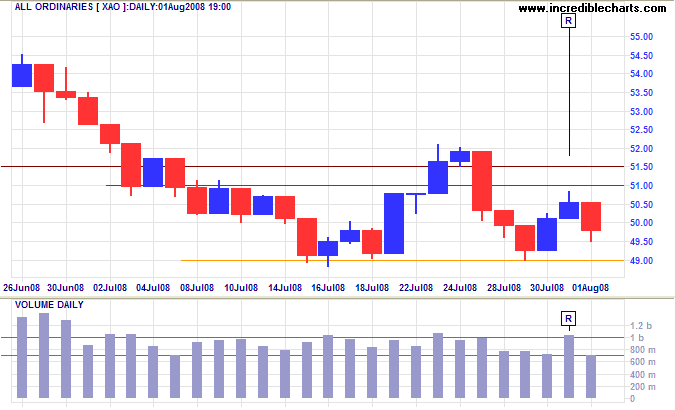
The All Ordinaries encountered resistance at 5100, highlighted by Thursday's tall shadow and strong volume [R]. Bullish influence from the Dow should ensure that 4900 is respected. Breakout above 5200 would signal another bear rally.
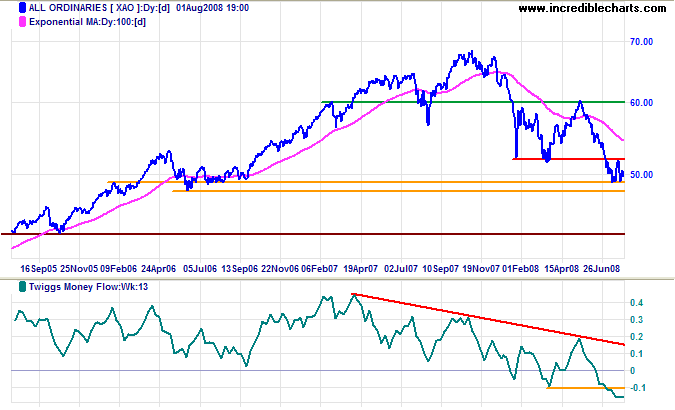
Long Term: Reversal below support at 4900 would offer a target of 4400 [5200-(6000-5200)]. Declining 13-week Twiggs Money Flow continues to signal a bear market.
Governments tend not to solve problems,
only to rearrange them.
~
Ronald Reagan
To understand my approach, please read About The Trading Diary.

Author: Colin Twiggs is a former investment banker with almost 40 years of experience in financial markets. He co-founded Incredible Charts and writes the popular Trading Diary and Patient Investor newsletters.
Using a top-down approach, Colin identifies key macro trends in the global economy before evaluating selected opportunities using a combination of fundamental and technical analysis.
Focusing on interest rates and financial market liquidity as primary drivers of the economic cycle, he warned of the 2008/2009 and 2020 bear markets well ahead of actual events.
He founded PVT Capital (AFSL No. 546090) in May 2023, which offers investment strategy and advice to wholesale clients.
