Oil Corrects, Dow Resists
By Colin Twiggs
July 19, 3:00 a.m. ET (5:00 p.m. AET)
These extracts from my trading diary are for educational purposes and should not be interpreted as investment or trading advice. Full terms and conditions can be found at Terms of Use.
Crude Oil
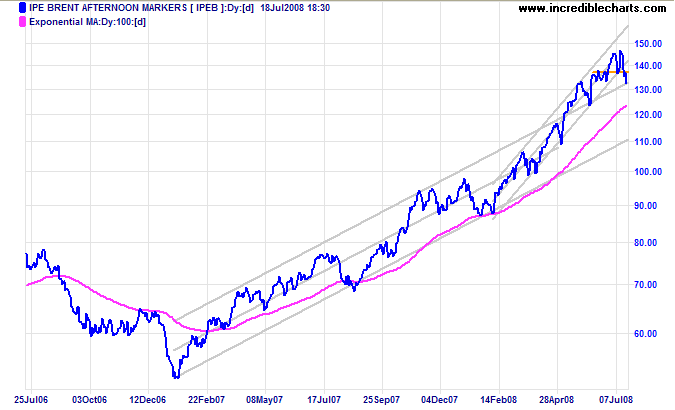
Brent crude broke downwards from its 5 month trend channel, signaling the start of a secondary correction. Expect a test of the lower border of the long-term trend channel at $110/barrel.
USA
Dow Jones Industrial Average
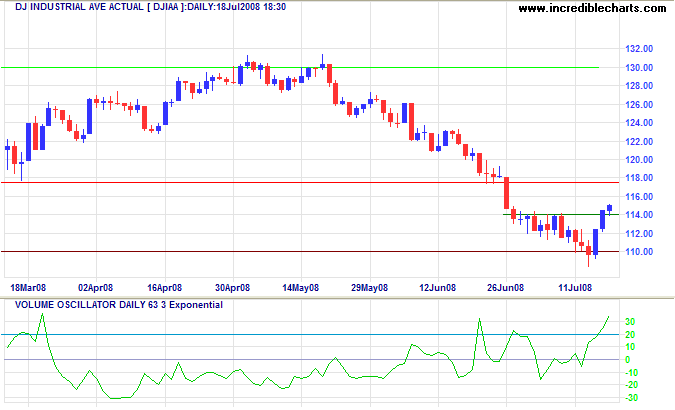
Inspired by falling crude oil prices, and assisted by the covering of short trades in financial stocks, the Dow rallied sharply above support at 11000. Rising volume, however, indicates strong resistance and the rally is unlikely to break 11750. Reversal below 11000 would signal another down-swing, with a target of 10700 (the June 2006 low).
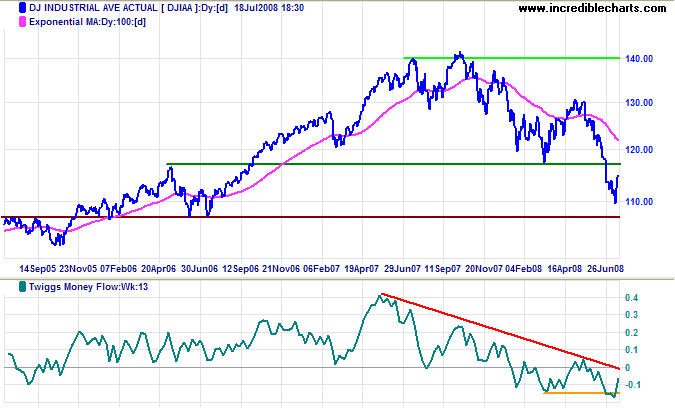
Long Term: Declining Twiggs Money Flow indicates continued selling pressure. If 10700 was to fail, the next major support band would be 10000/9700.
S&P 500
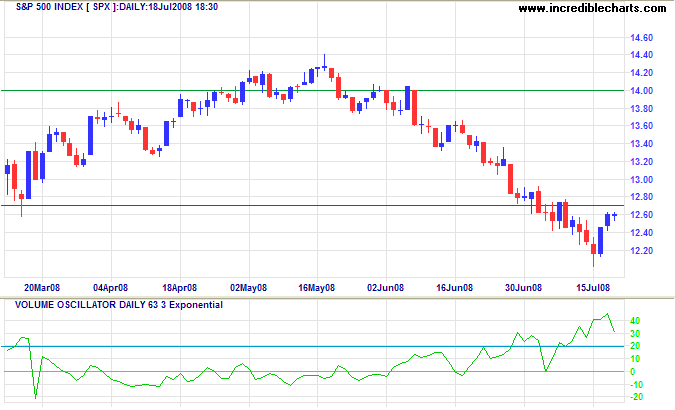
The S&P 500 retraced to test the former primary support level at 1270. Rising volume and an inside day on Friday warn of resistance and breakout above 1270 is unlikely. Reversal below Thursday's low of 1240 would indicate another decline.
Transport
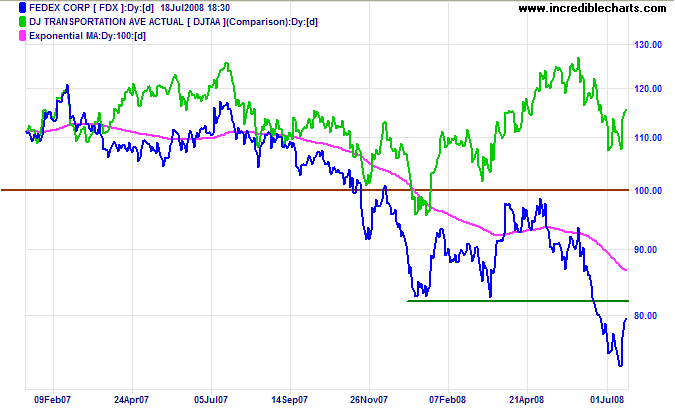
Transport stocks rallied on the back of lower oil prices, but remain in a strong primary down-trend — with negative implications for the broader economy.
Small Caps
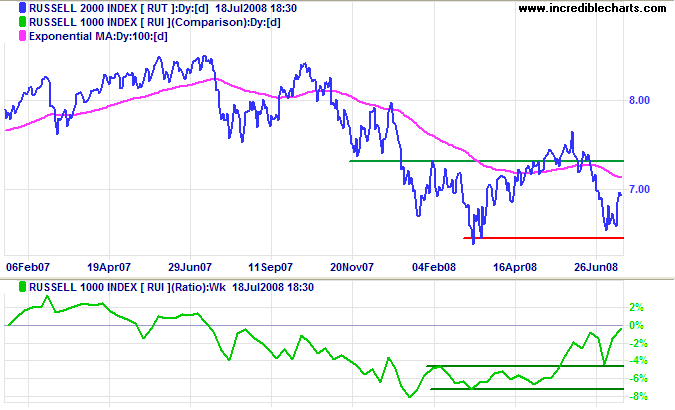
The Russell 2000 Small Caps index once again respected primary support at 645. The ratio to the Russell 1000 recovered above its recent high, indicating that small caps continue to be favored over "safer" large caps.
Technology
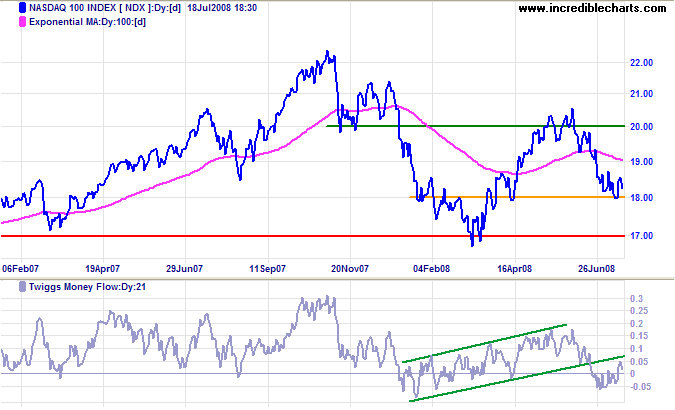
The Nasdaq 100 is not as exposed to oil or financial stocks and remains in a narrow consolidation above 1800. This is a continuation pattern and downward breakout is likely, with a target of 1700. Twiggs Money Flow recovered slightly but remains close to zero, reflecting indecision.
Canada: TSX
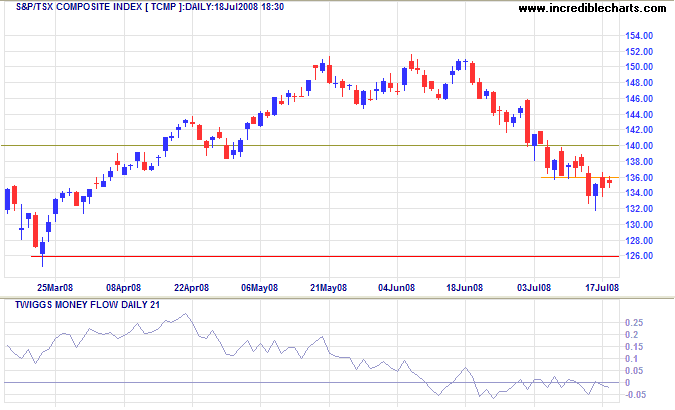
The TSX Composite broke short-term support at 13600, confirming the down-trend. We now have another short-term consolidation between 13200 and 13600. Twiggs Money Flow remains below zero, indicating selling pressure. Expect a breakout below 13200 and a test of primary support at 12700/12600.
United Kingdom: FTSE
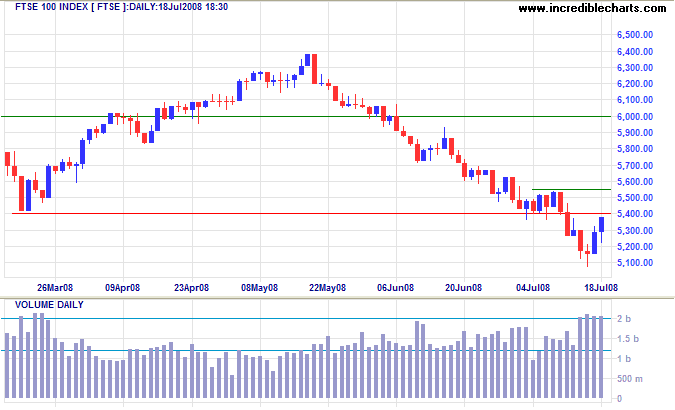
The FTSE 100 retraced to test the former primary support at 5400. Strong volume signals resistance and reversal below Friday's low at 5200 would warn of another primary down-swing, with a target of 5400-(6400-5400)=4400. Recovery above 5550 is unlikely — and would signal a bear trap. Twiggs Money Flow (21-day) remains below zero, indicating continued selling pressure.
Europe: DAX
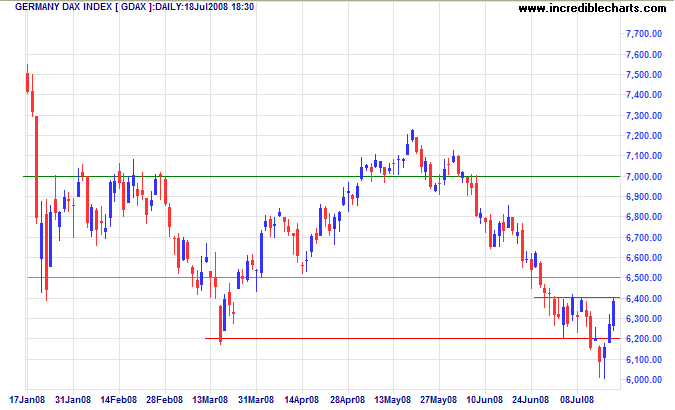
The German Dax recovered above the former primary support level at 6200. Breakout above 6400 would warn of a bear trap, testing 7000. Reversal below 6200, however, would signal another primary down-swing, with a target of 5300 — the June 2006 low.
India: Sensex
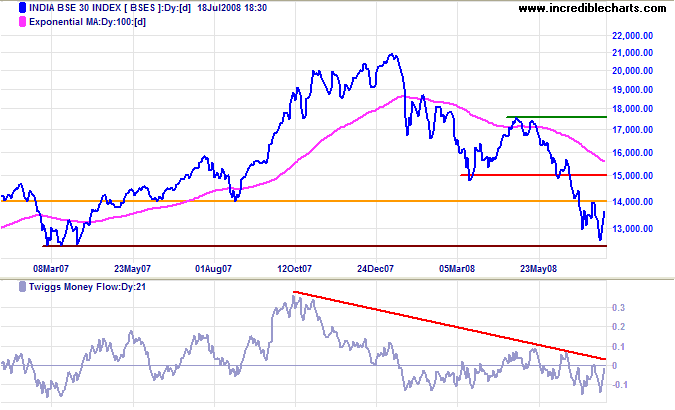
The Sensex respected support at the March 2007 low of 12400 and is now headed for another test of resistance at 14000. Breakout above 14000 would signal a test of the former primary support level at 15000. Twiggs Money Flow penetration of the decending trendline, indicating medium-term buying pressure, would support this. Reversal below 12400, on the other hand, would warn of another primary down-swing.
Japan: Nikkei
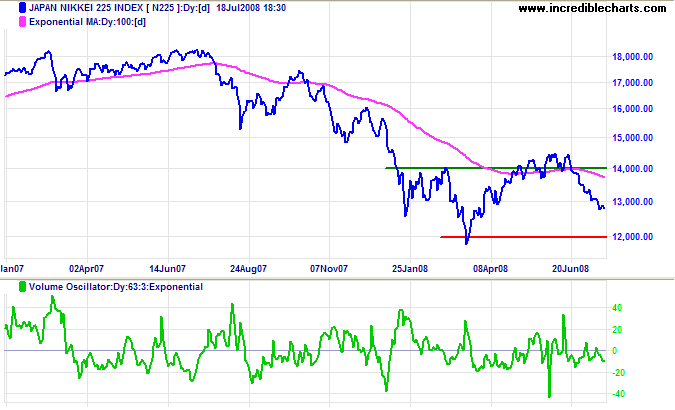
The Nikkei 225 broke through support at 13000 and is headed for a test of primary support at 12000/11800. Low volume and declining Twiggs Money Flow indicate continuation of the down-trend.
China
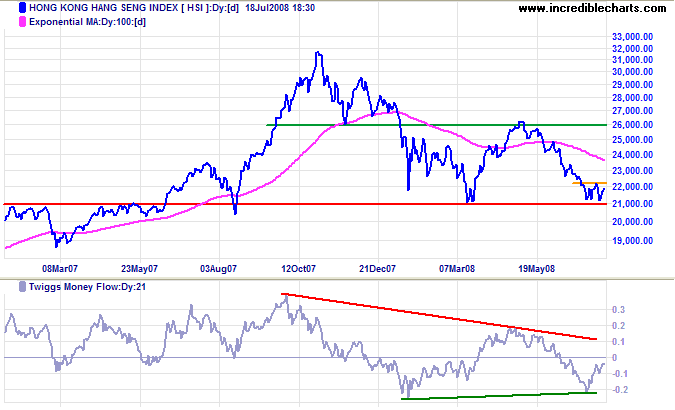
The Hang Seng is consolidating in a narrow range above primary support at 21000 — a continuation pattern. Failure of support would signal another primary down-swing, with a target of 16000 [21000-(26000-21000)]. Breakout from the triangle on Twiggs Money Flow (21-day) will indicate future direction.
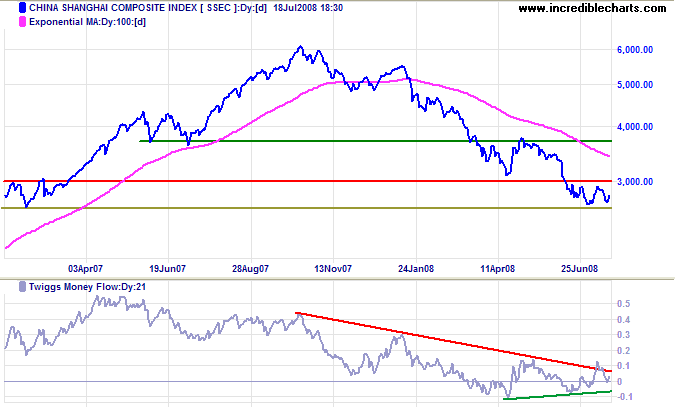
The Shanghai Composite is in a similar consolidation, between 2700 and 3000. Reversal below 2700 would warn of another primary down-swing, with a target of 2000. A clear breakout above the triangle on Twiggs Money Flow, however, would indicate recovery above 3000 — and a test of 3700.
Australia: ASX
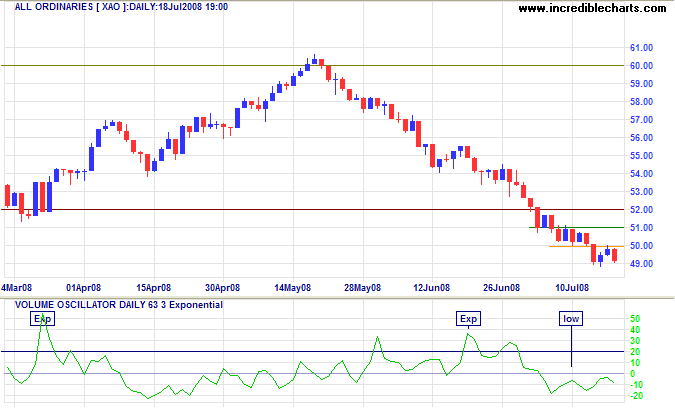
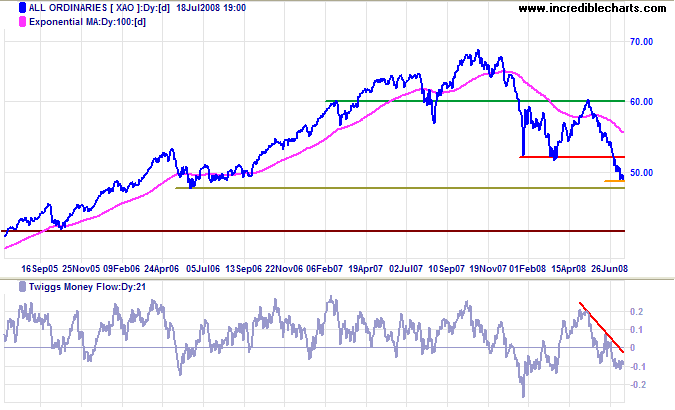
The All Ordinaries is consolidating in a narrow band below 5000 — a continuation signal. Light volume also indicates that the down-trend is likely to continue.
Long Term: Expect support at 4800, the June 2006 low, but the calculated target is 4400 [5200-(6000-5200)]. Declining Twiggs Money Flow signals continued selling pressure.
Be careful to leave your sons well instructed rather than rich,
for the hopes of the instructed are better than the wealth of the ignorant.
~ Epictetus (first century A.D.)
To understand my approach, please read About The Trading Diary.

Author: Colin Twiggs is a former investment banker with almost 40 years of experience in financial markets. He co-founded Incredible Charts and writes the popular Trading Diary and Patient Investor newsletters.
Using a top-down approach, Colin identifies key macro trends in the global economy before evaluating selected opportunities using a combination of fundamental and technical analysis.
Focusing on interest rates and financial market liquidity as primary drivers of the economic cycle, he warned of the 2008/2009 and 2020 bear markets well ahead of actual events.
He founded PVT Capital (AFSL No. 546090) in May 2023, which offers investment strategy and advice to wholesale clients.
