Financial Tremors
By Colin Twiggs
June 21, 3:00 a.m. ET (5:00 p.m. AET)
These extracts from my trading diary are for educational purposes and should not be interpreted as investment or trading advice. Full terms and conditions can be found at Terms of Use.
Crude Oil & Financials
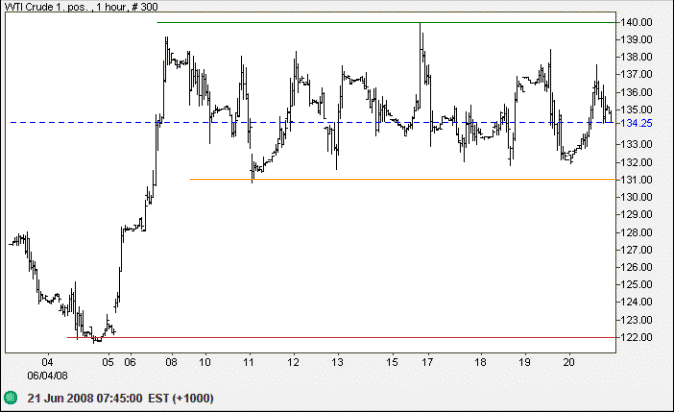
West Texas Intermediate Crude formed a short-term consolidation between $131 and $140. Narrow consolidations are continuation patterns: expect an upward breakout with a target of $135+(135-122)=$148. Breakout below $132 is less likely and would warn of a test of $122.
Rising fuel prices and the credit squeeze in financial markets are both likely to slow consumption, causing stock markets to weaken.
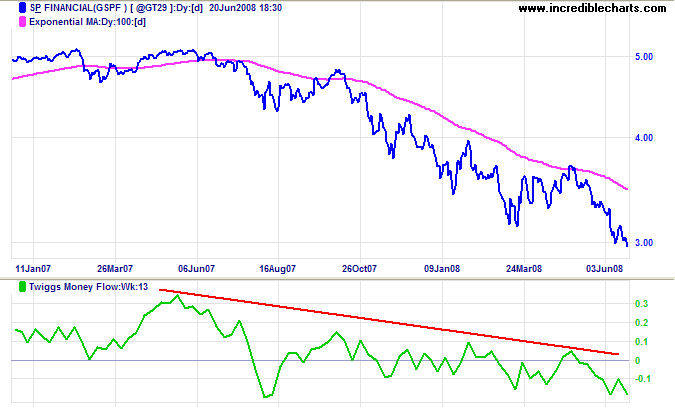
The S&P Financial Index illustrates the extent of the problem in the financial sector. Falling housing prices, bond insurer downgrades, and risks of counterparty failure in the $60 trillion credit default swap market all suggest that the down-trend is far from over.
USA
Dow Jones Industrial Average
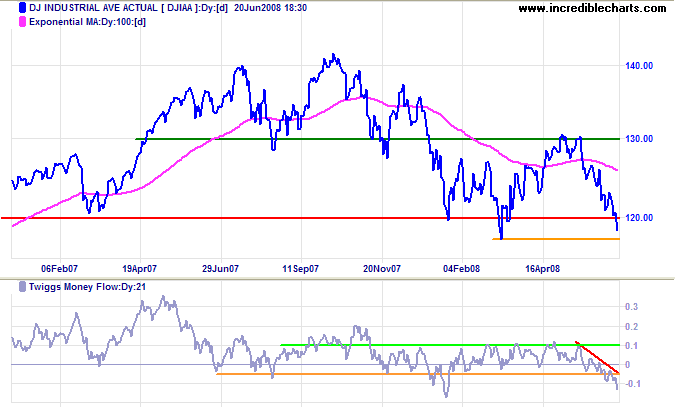
The Dow broke through 12000 and is headed for a test of primary support at 11750. Large volumes are attributable to triple witching hour: the simultaneous expiry of stock index futures, stock index options and stock options on the third Friday of March, June, September and December.
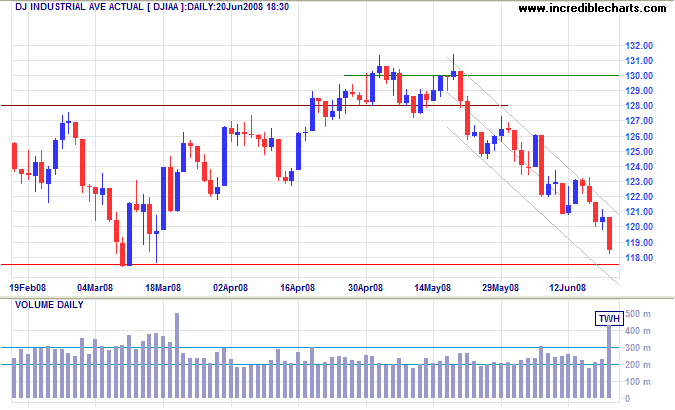
Long Term: Failure of primary support at 11750 would offer a target of 12000-(13000-12000)=11000. Twiggs Money Flow fall below its March low signals unusual selling pressure and support is unlikely to hold.
S&P 500
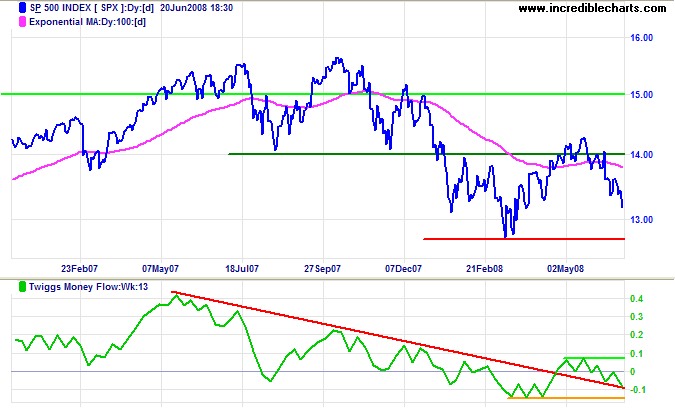
The S&P 500 is also weakening and should test primary support at 1270. Twiggs Money Flow (13-week) fall below its March low would warn of another primary decline.
Transport
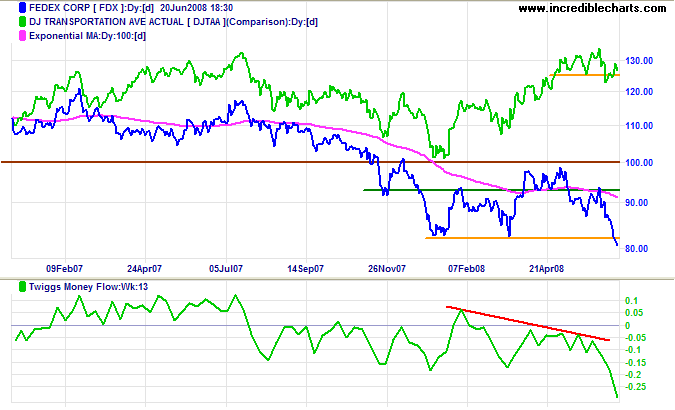
FedEx CFO Alan Graf predicted that the coming year will be "very difficult due to the weak US economy and extremely high fuel prices." The bellweather stock broke through primary support to signal another decline with a target of 80-(100-80)=60. The Dow Transport index is expected to break short-term support at 5150 and follow FedEx southwards. Prospects for the wider economy are bearish.
Small Caps
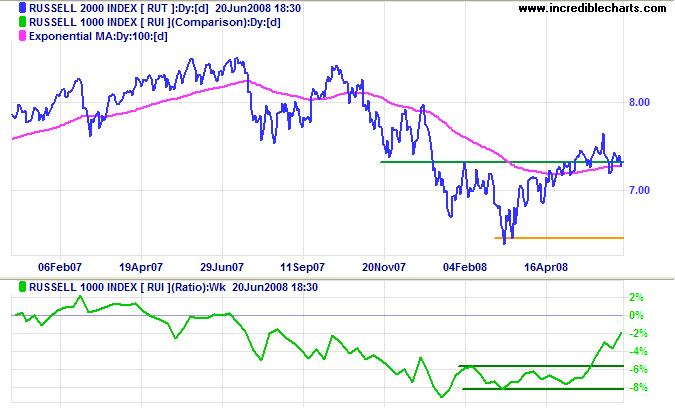
The Russell 2000 Small Caps index is whipsawing around 730. A fall below 718 would warn of a test of primary support at 645; while recovery above 765 would confirm the primary up-trend. The ratio to the large cap Russell 1000 is rising steeply, indicating that small caps are firmly favored over large cap stocks.
Technology
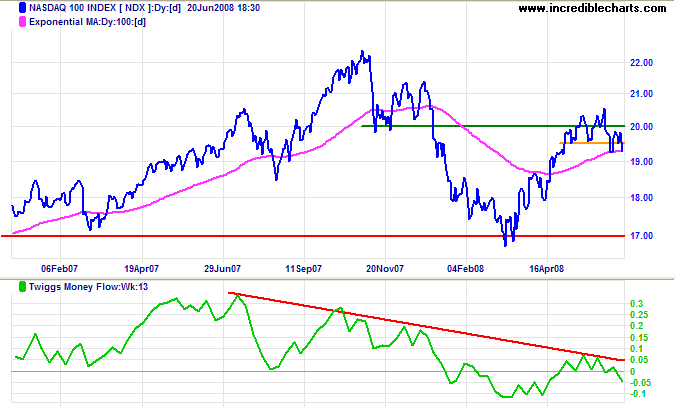
The Nasdaq 100 reversed below short-term support at 1950, signaling a test of primary support at 1700. Long- and short-term Twiggs Money Flow are both weakening and a TMF (13-week) fall below its March low would warn of another primary decline — with a target of 1700-(2000-1700)=1400.
United Kingdom: FTSE
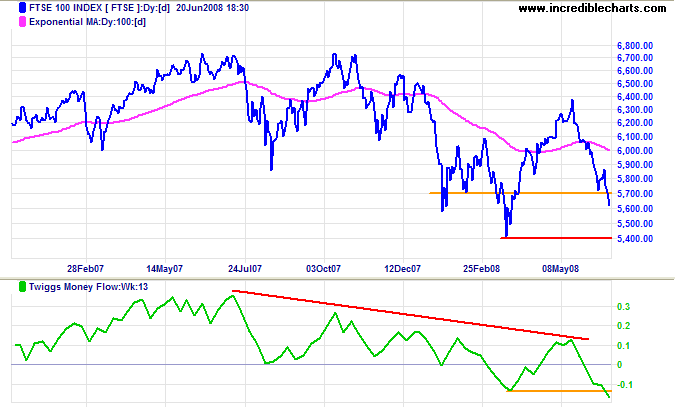
The FTSE 100 broke through support at 5700 and is headed for a test of primary support at 5400. Twiggs Money Flow (13-week) below its March low warns of another primary decline. The target would be 5400-(6400-5400)=4400.
India: Sensex
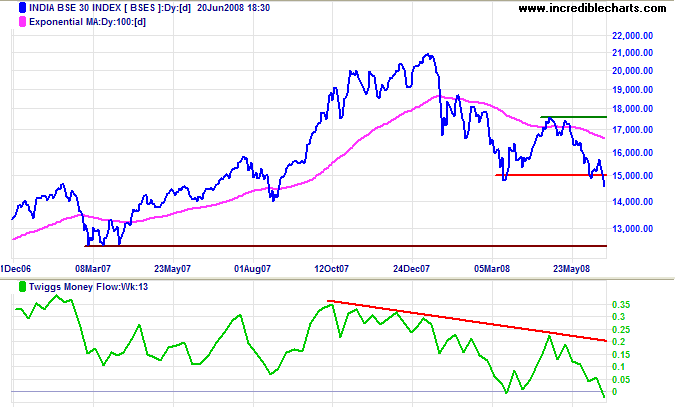
The Sensex broke through primary support at 14800 to signal another decline — with a target of 15000-(17500-15000)=12500. Twiggs Money Flow (13-week) fell below zero, confirming the signal.
Japan: Nikkei
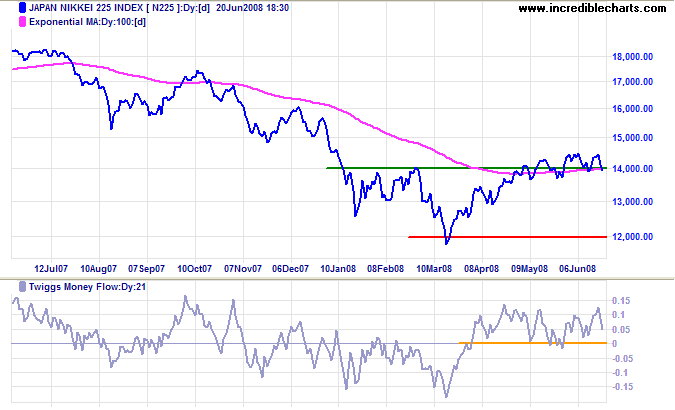
The Nikkei 225 is whipsawing around 14000. Failure of short-term support at 13800 would warn of a test of primary support at 12000/11800. Twiggs Money Flow continues to oscillate above the zero line, signaling buying pressure. A rise above 14600 is now reduced to even probability, given the bearish influence of the US market, and would signal the the start of a primary advance.
China
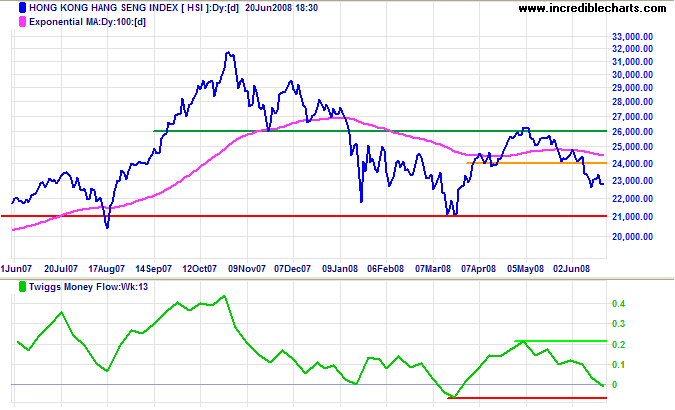
The Hang Seng is headed for a test of primary support at 21000. Failure of primary support would offer a target of 21000-(26000-21000)=16000. Twiggs Money Flow reversal below its March low would also warn of a primary decline.
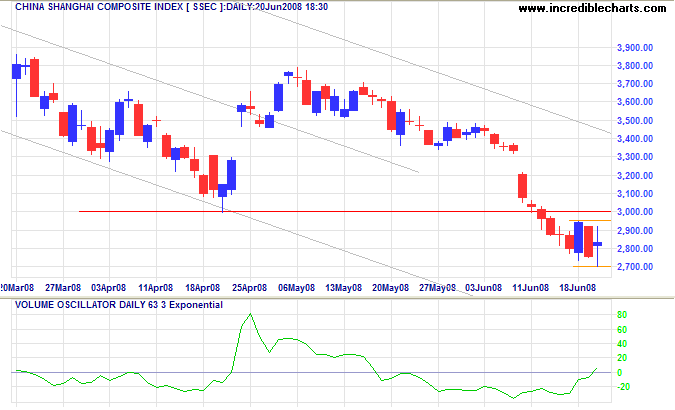
The Shanghai Composite is consolidating between 3000 and 2700, while rising volume shows both committed buyers and sellers. Future direction will be indicated by a breakout. Twiggs Money Flow (13-week) below its March low signals increasing selling pressure. The long-term target is 2000 (the index tends to move in steps of a thousand).
Australia: ASX
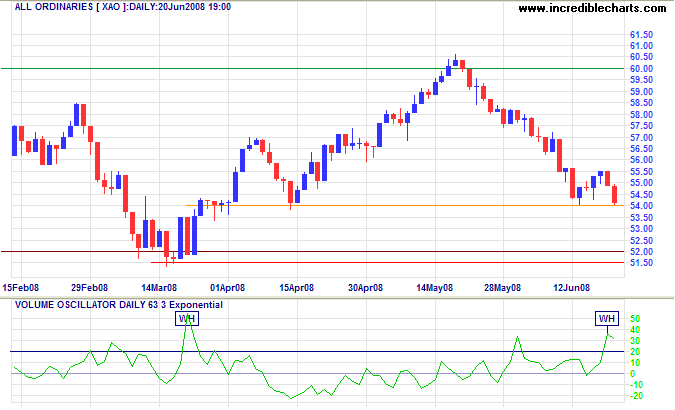
Strong volumes on the All Ordinaries are a result of the expiry of stock index futures and options. Support at 5400 is not likely to hold, given the bearish influence from other markets and breakout would test primary support at 5200/5150.
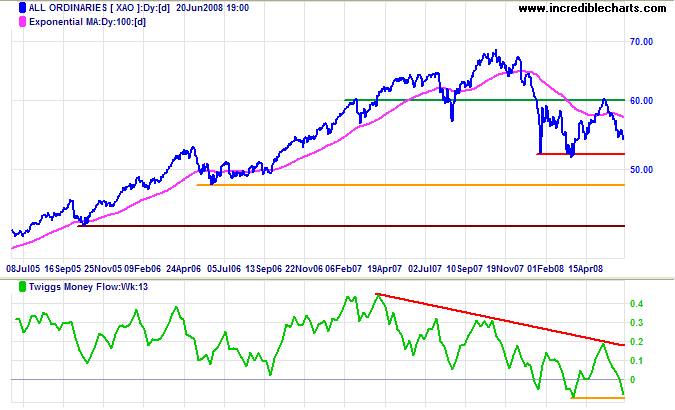
Long Term: Failure of primary support would offer a target of 5200-(6000-5200)=4400. Respect of primary support is less likely — and would signal another test of 6000. Twiggs Money Flow (13-week) fall below its March low would warn of a primary decline.
Ludwig von Mises used to say that governments will always try to get people to focus on prices when thinking about inflation.
But rising prices are a result of inflation, not inflation itself.
Inflation is the increase in the money supply.
If we understood inflation that way, we would instantly know how to cure it:
simply demand that the Federal Reserve cease increasing the money supply.
~ Ron Paul:
The Revolution — A Manifesto.
To understand my approach, please read About The Trading Diary.

Author: Colin Twiggs is a former investment banker with almost 40 years of experience in financial markets. He co-founded Incredible Charts and writes the popular Trading Diary and Patient Investor newsletters.
Using a top-down approach, Colin identifies key macro trends in the global economy before evaluating selected opportunities using a combination of fundamental and technical analysis.
Focusing on interest rates and financial market liquidity as primary drivers of the economic cycle, he warned of the 2008/2009 and 2020 bear markets well ahead of actual events.
He founded PVT Capital (AFSL No. 546090) in May 2023, which offers investment strategy and advice to wholesale clients.
