Crude Pennant
By Colin Twiggs
June 14, 1:00 a.m. ET (3:00 p.m. AET)
These extracts from my trading diary are for educational purposes and should not be interpreted as investment or trading advice. Full terms and conditions can be found at Terms of Use.
If you haven't already done so, please help us to improve our newsletter and charting services by completing this quick one-minute survey.
Crude Oil
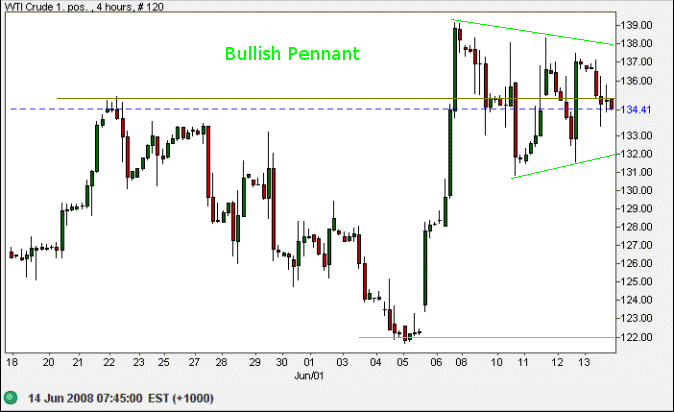
West Texas Intermediate Crude is forming a pennant continuation pattern around the former resistance level of $135. Expect an upward breakout with a target of $135+(135-122)=$148. Breakout below $132 is less likely and would warn of a test of $122.
Rising fuel prices affect consumer confidence and are likely to slow consumption, which in turn would cause stock markets to weaken. Buying support, however, is evident on the S&P 500, FTSE 100, Nikkei 225 and Sensex. With commodities at record highs and real estate falling, perhaps stocks are seen as the lowest risk inflation hedge available.
USA
Dow Jones Industrial Average
The Dow rallied to its upper trend channel, but modest volumes indicate a lack of buying support. Reversal below 12100 is likely and would test primary support at 11750. Twiggs Money Flow holding below zero warns that sellers are dominant.
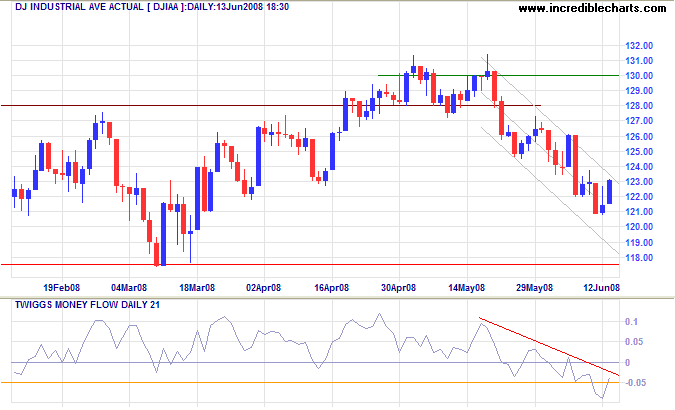
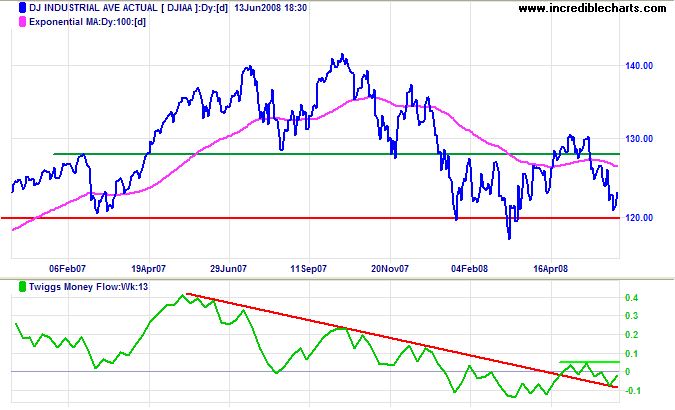
Long Term: Failure of 11750 would offer a target of 12000-(13000-12000)=11000. The Dow tends to move in steps of a thousand. Respect of support is less likely — and would signal another test of resistance at 13000. Twiggs Money Flow reversal below its March low would warn of a primary decline, while recovery above 0.5 would indicate the start of a primary up-trend.
S&P 500
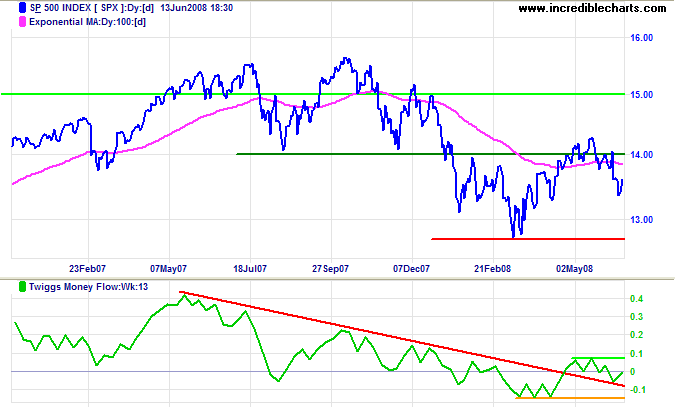
Large volumes on the S&P 500 reveal stronger support than the Dow. Recovery above 1400/1405 would signal a primary advance, but reversal below 1330 remains more likely because of the down-trend — and would test primary support at 1270. Twiggs Money Flow (13-week) rising above its May high would indicate the start of a primary advance, while a fall below its March low would signal continuation of the primary down-trend.
Transport
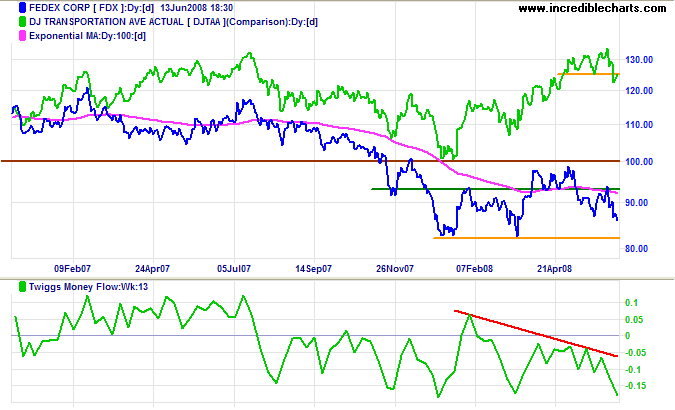
Fedex is headed for a test of primary support at $80.00, while Twiggs Money Flow (13-week) warns of another primary decline. The Dow Transport index broke short-term support at 5150, warning of a secondary correction. Prospects for the wider economy are bearish.
Small Caps
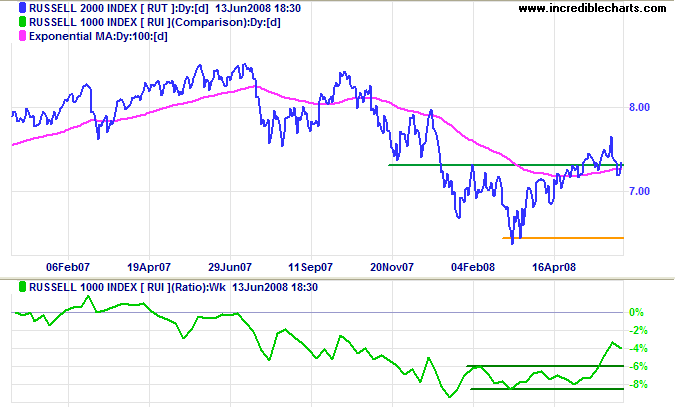
The Russell 2000 Small Caps recovery above 730 suggests that the primary up-trend is intact. This would be confirmed if the index rises above its recent high. The ratio to the large cap Russell 1000 is rising, indicating that small caps are being favored over larger blue chip stocks.
Technology
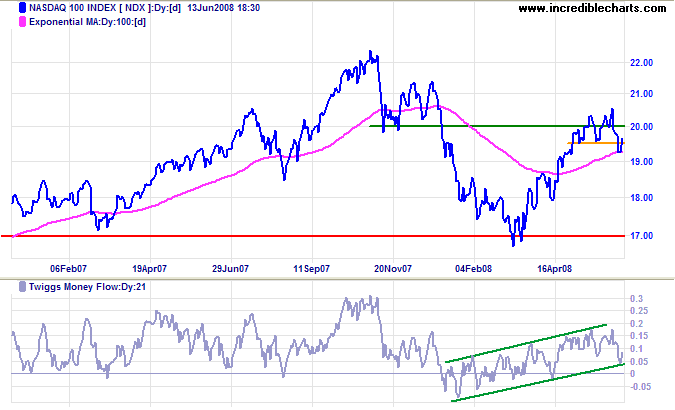
The Nasdaq 100 dipped below short-term support at 1950, warning of a test of primary support at 1700. Twiggs Money Flow, however, contradicts this, the rising channel suggesting that buyers remain in control.
United Kingdom: FTSE
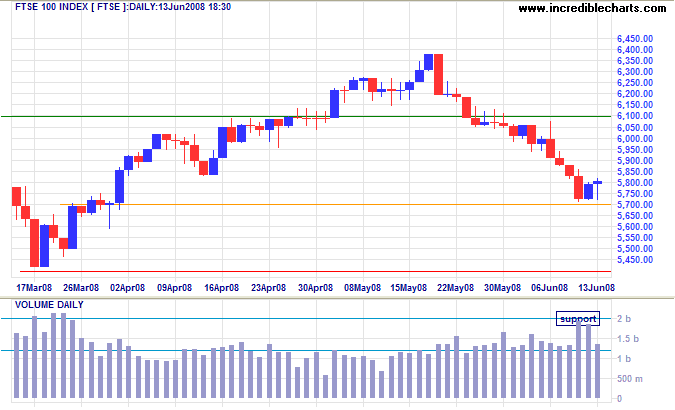
Strong volume on the FTSE 100 shows committed buyers at 5700. Expect a short reaction or a consolidation. Failure of support remains likely because of the down-trend — and would test primary support at 5400. Recovery above 6100, while unlikely, would indicate that the secondary correction has ended. Twiggs Money Flow below zero warns of long term selling pressure.
India: Sensex
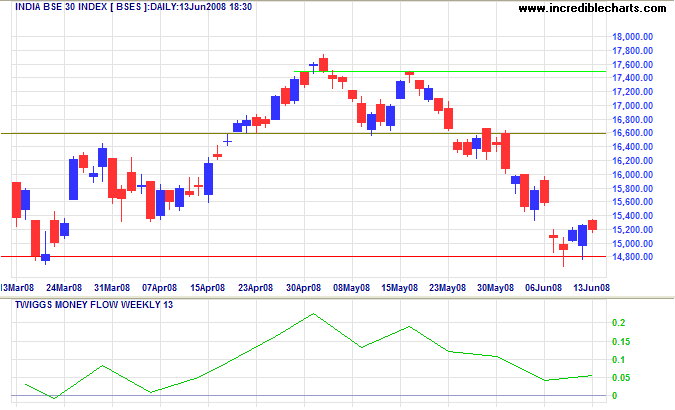
The Sensex is testing primary support at 15000/14800. Failure would offer a target of 15000-(17500-15000)=12500. Strong volume, however, shows committed buyers and Twiggs Money Flow (13-week) respecting zero would suggest the start of a primary up-trend.
Japan: Nikkei
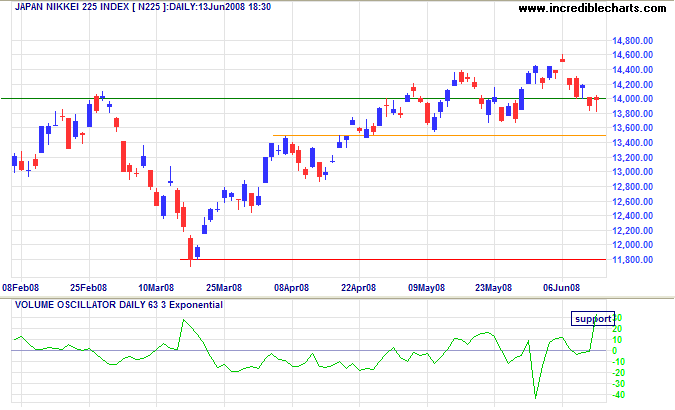
The Nikkei 225 is once again testing support at 14000. Strong volume, signaled by a sharp spike in the Volume Oscillator, shows committed buyers — and is confirmed by Twiggs Money Flow oscillating above the zero line. Expect a rise above 14600 to signal the the start of a primary advance. Reversal below 13500 is now most unlikely — and would warn of a test of 11800.
China
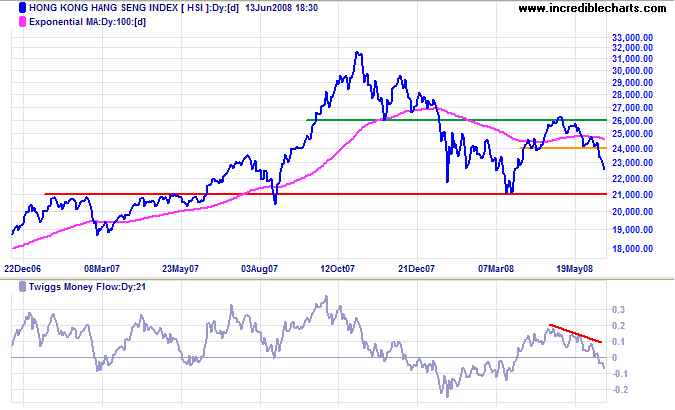
The Hang Seng broke through short-term support at 24000, warning of a test of primary support at 21000. Recovery above 25000 is now most unlikely — and would signal the start of a primary advance. Twiggs Money Flow reversal below zero indicates selling pressure. Failure of primary support would offer a target of 21000-(26000-21000)=16000.
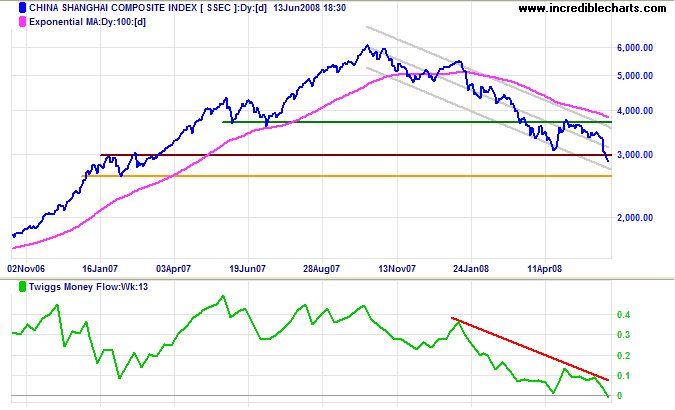
The Shanghai Composite broke through primary support at 3000, offering a long-term target of 2000. The index tends to move in steps of a thousand. Twiggs Money Flow (13-week) falling below zero confirms the primary decline. Recovery above 3000 is not expected — and would warn of a bear trap.
Australia: ASX
Rising volumes on the All Ordinaries indicate short-term support at 5400. Expect a short reaction against the down-trend — or a consolidation above the support level. Downward breakout would test primary support at 5200/5150.
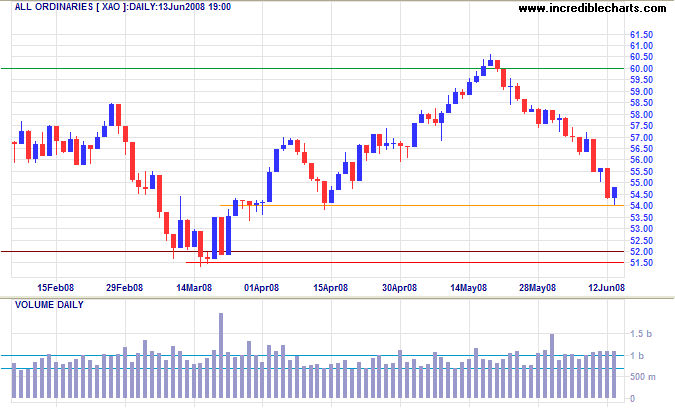
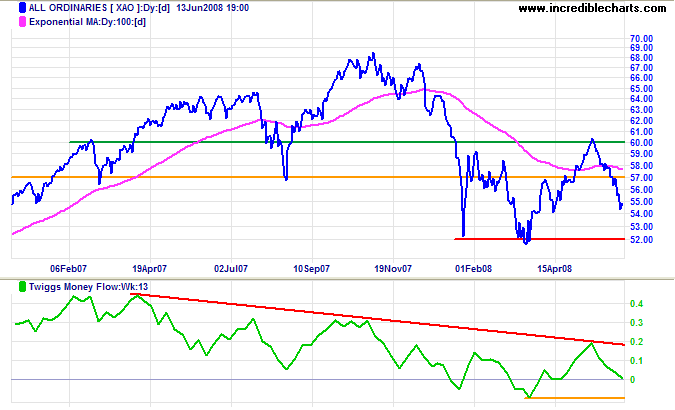
Long Term: Failure of primary support would offer a target of 5200-(6000-5200)=4400. Respect of primary support, while less likely, would signal another test of 6000. Twiggs Money Flow (13-week) fall below its March low would warn of another primary decline, while recovery above 0.2 would indicate the start of a primary up-trend.
Diplomacy is the art of saying 'Nice doggie'
until you can find a rock.
~ Will Rogers.
To understand my approach, please read About The Trading Diary.

Author: Colin Twiggs is a former investment banker with almost 40 years of experience in financial markets. He co-founded Incredible Charts and writes the popular Trading Diary and Patient Investor newsletters.
Using a top-down approach, Colin identifies key macro trends in the global economy before evaluating selected opportunities using a combination of fundamental and technical analysis.
Focusing on interest rates and financial market liquidity as primary drivers of the economic cycle, he warned of the 2008/2009 and 2020 bear markets well ahead of actual events.
He founded PVT Capital (AFSL No. 546090) in May 2023, which offers investment strategy and advice to wholesale clients.
