Techs v. Oil
By Colin Twiggs
May 31, 2:00 a.m. ET (4:00 p.m. AET)
These extracts from my trading diary are for educational purposes and should not be interpreted as investment or trading advice. Full terms and conditions can be found at Terms of Use.
Crude Oil
July crude oil retraced below $130 before finding short-term support at $125. Recovery above $130 would signal another rally, while failure of support at $125/$123 would warn of a secondary correction.
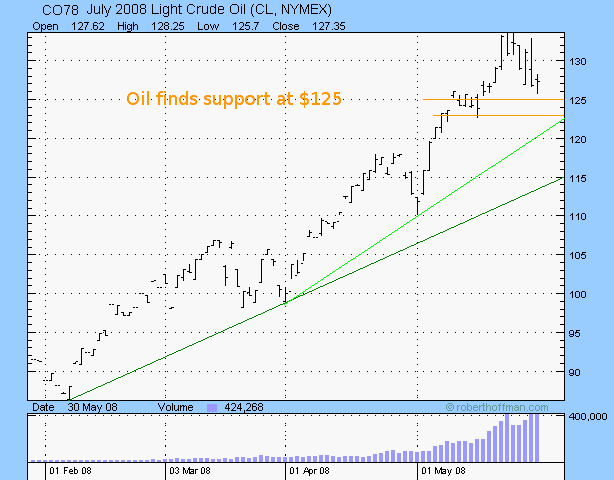
Rising crude oil prices have sapped consumer confidence and the resultant down-turn in consumer spending is
likely to weaken the Dow and other major indexes.
There appear to be two opposing views, however, with bears dominating the Dow and FTSE 100,
while bulls are evident on the tech-heavy NASDAQ 100, transport and small cap indexes
— and in Asian markets.
Expect oil to win the argument if prices remain above $125.
USA
Dow Jones Industrial Average
Unusually low volumes reflect investor wariness. Tall shadows for the last two days indicate resistance at 12700.
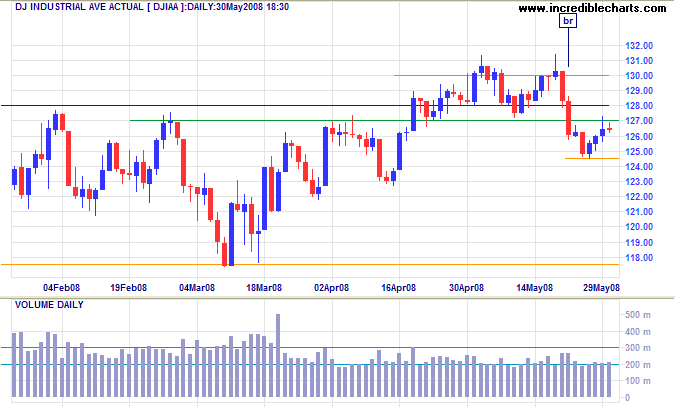
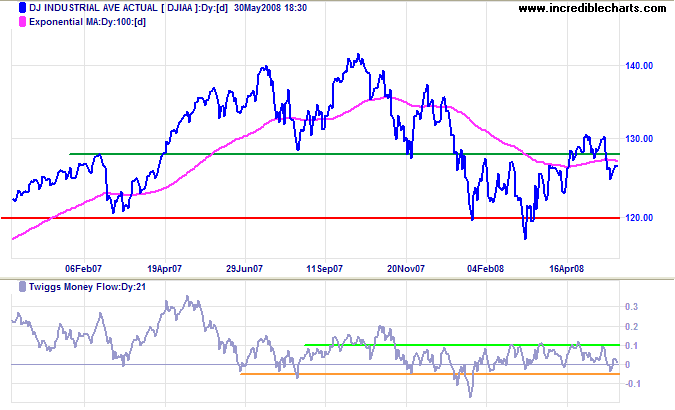
Long Term: Reversal below 12450 would confirm another test of primary support at 11750. Twiggs Money Flow breakout below -0.05 would likewise signal a test of primary support.
S&P 500
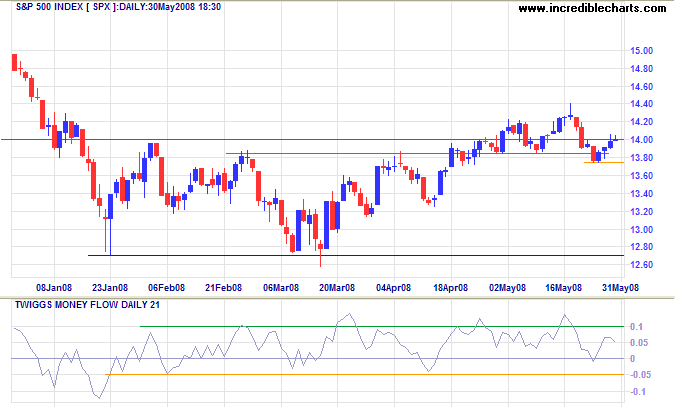
The S&P 500 encountered similar resisance at 1400. Reversal below 1375 would signal a test of primary support at 1270. A rise above Thursday's high (1410) is not expected and would test 1430. Twiggs Money Flow reversal below -0.05 would warn of a test of primary support.
Transport
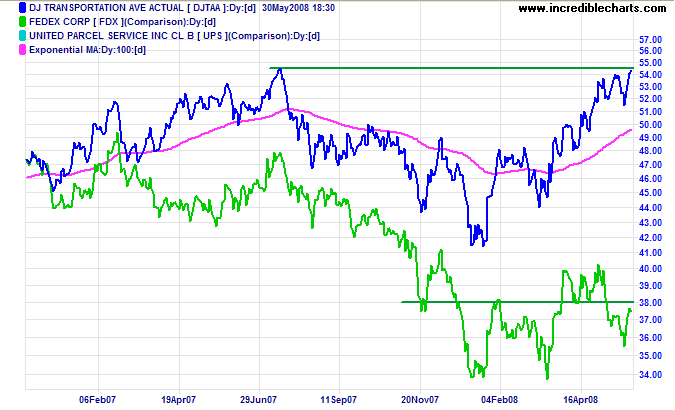
The Dow Transport index is surprisingly strong considering current high oil prices — testing resistance at its July 2007 high. Fedex more closely mirrors the industrial average and is expected to test support at its 2008 lows. Conflicting signals for the economy.
Small Caps
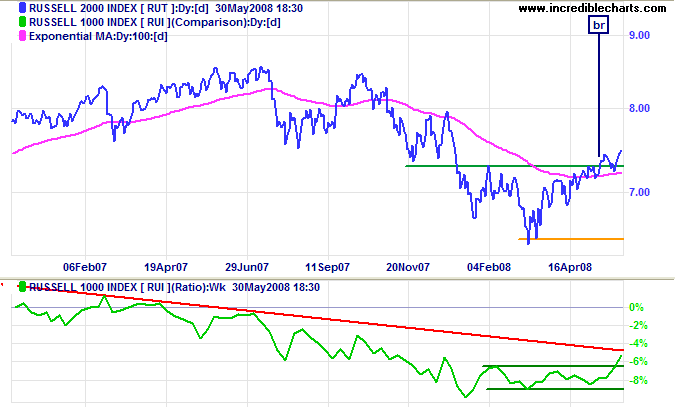
The Russell 2000 Small Caps index confirmed the breakout above 730 and the start of a primary advance. The ratio to the large cap Russell 1000 broke above its range of recent months, indicating that small caps are now favored over larger blue chip stocks. This normally only occurs towards the end of a bull market and we will need to monitor this over the next few weeks to assess the broader implications.
Technology
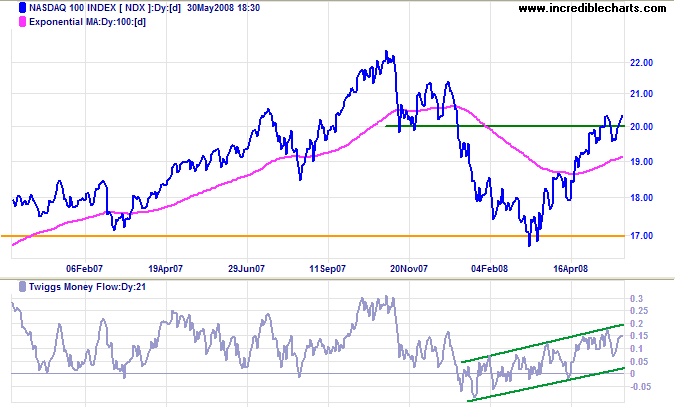
The Nasdaq 100 recovered above 2000, confirming the earlier breakout. Expect a test of the earlier high at 2200. Reversal below 1950 is now unlikely — and would signal a test of primary support at 1700. Twiggs Money Flow in a rising trend channel indicates long-term buying pressure.
United Kingdom: FTSE
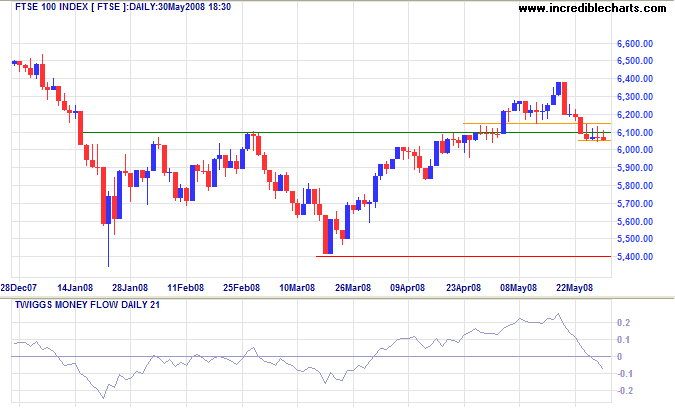
The FTSE 100 is testing support at 6050. There again appears to be some form of intervention, with closing price flat-lining at the support level. That is unusual, even for a narrow consolidation, where you would still normally observe an ebb and flow between the upper and lower borders. Twiggs Money Flow falling sharply warns of selling pressure. Failure of support at 6000/6050 would signal a test of primary support at 5400. Recovery above 6150 is unlikely in the short term.
India: Sensex
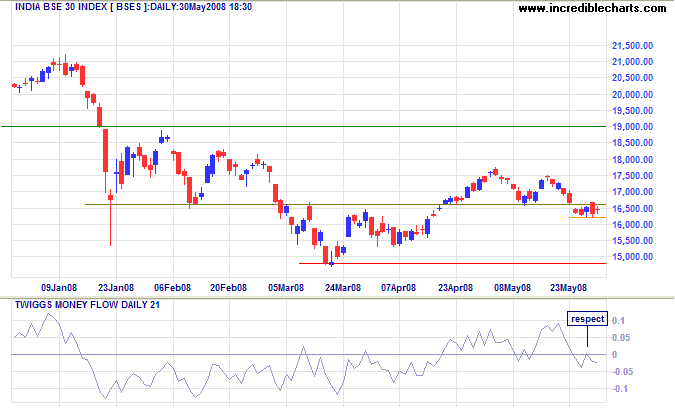
The Sensex narrow consolidation below 16600 warns of a test of primary support at 15000/14800. Twiggs Money Flow reversal below zero indicates selling pressure.
Japan: Nikkei
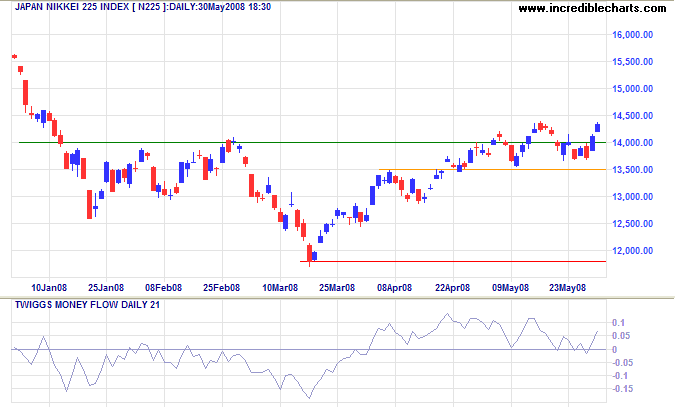
The Nikkei 225 recovered above 14000, confirming the start of a primary advance. Twiggs Money Flow continues to oscillate above the zero line, signaling long-term buying pressure.
China
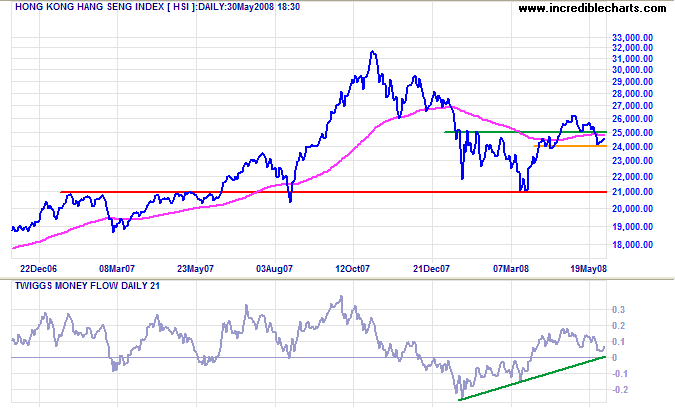
The Hang Seng found support at 24000. Failure would warn of a test of primary support at 21000, while recovery above 25000 would confirm the start of a primary advance. Twiggs Money Flow holding above zero favors a recovery.
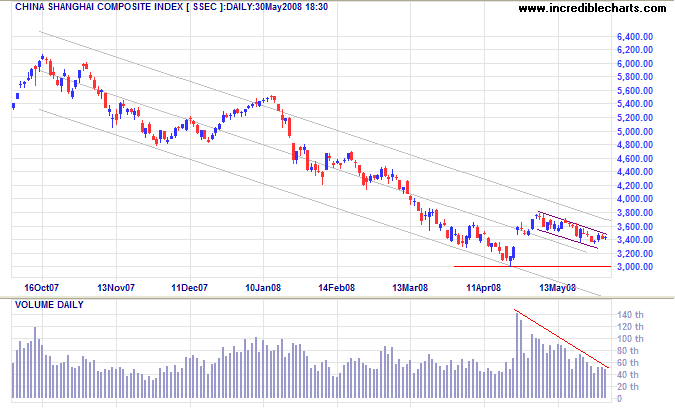
The flag continuation pattern on the Shanghai Composite is approaching 20 days, with typical declining volume. Watch for an upward breakout accompanied by increased volume. Twiggs Money Flow reversal below zero, however, would warn of selling pressure.
Australia: ASX
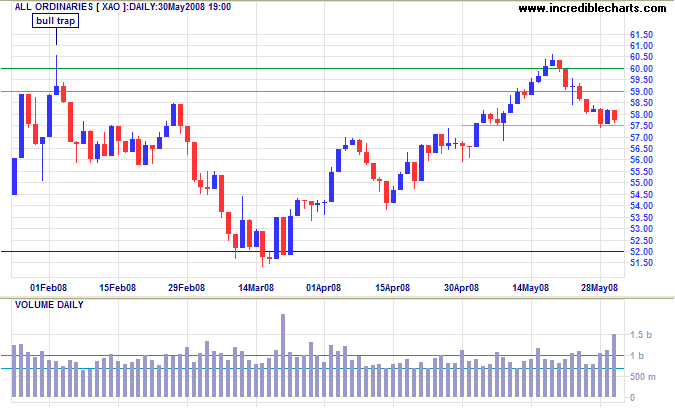
The All Ordinaries is consolidating at the key support level of 5750, strong volume and a narrow range revealing committed buyers and sellers. Like the release of a coiled spring, breakout in either direction is likely to be rapid. Failure of support would signal a test of primary support at 5200; upward breakout would test resistance at 6000.
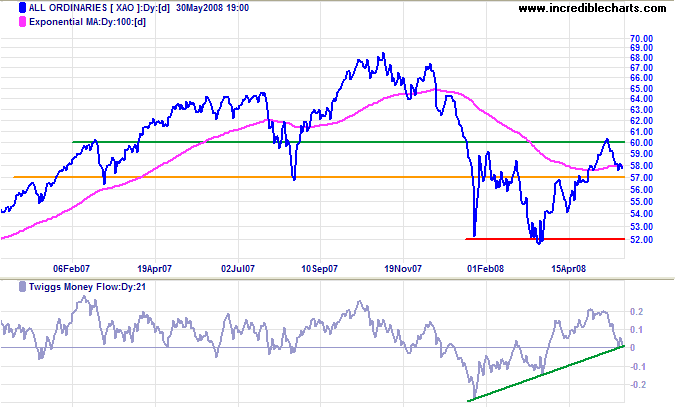
Long Term: Recovery above 6000 would offer a target of 6800, while failure of 5200 would suggest a target of 5200-(6000-5200)=4400. Twiggs Money Flow is falling sharply, indicating selling pressure. A break below zero would warn of a test of primary support.
A cynic is a man who, when he smells flowers,
looks around for a coffin.
~ H. L. Mencken (1880 - 1956).
To understand my approach, please read About The Trading Diary.

Author: Colin Twiggs is a former investment banker with almost 40 years of experience in financial markets. He co-founded Incredible Charts and writes the popular Trading Diary and Patient Investor newsletters.
Using a top-down approach, Colin identifies key macro trends in the global economy before evaluating selected opportunities using a combination of fundamental and technical analysis.
Focusing on interest rates and financial market liquidity as primary drivers of the economic cycle, he warned of the 2008/2009 and 2020 bear markets well ahead of actual events.
He founded PVT Capital (AFSL No. 546090) in May 2023, which offers investment strategy and advice to wholesale clients.
