Oil Spike Scares Markets
By Colin Twiggs
May 24, 4:00 a.m. ET (6:00 p.m. AET)
These extracts from my trading diary are for educational purposes and should not be interpreted as investment or trading advice. Full terms and conditions can be found at Terms of Use.
Crude Oil
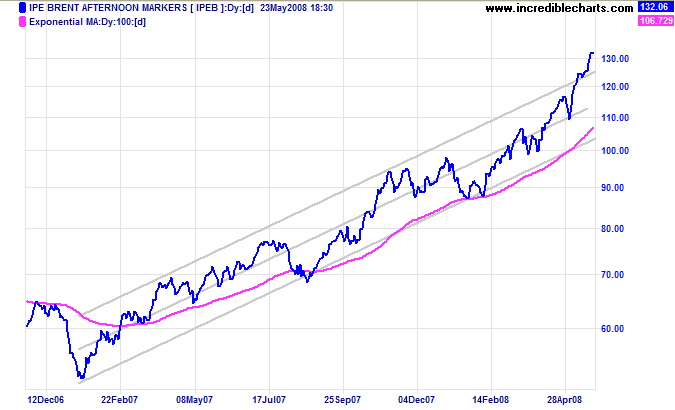
Crude oil prices broke out above the long term trend channel, signaling an accelerating up-trend (or spike). This is likely to be followed by a sharp drop, the market tends to overreact in both directions, but may be some weeks away — too late to relieve the pressure on equity markets.
USA
Dow Jones Industrial Average
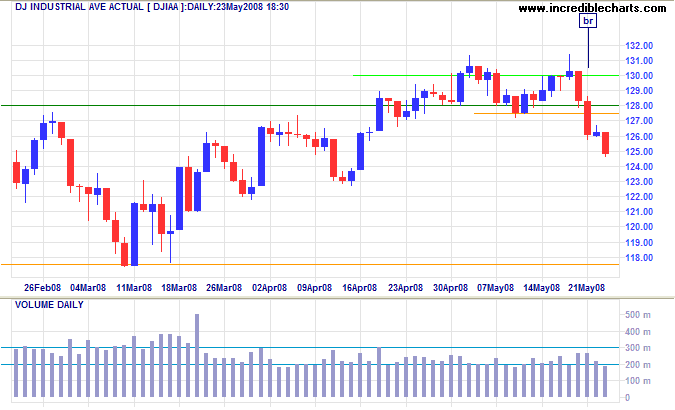
The Dow ran into solid resistance at 13000, before retreating below 12750 to complete a small double top. The signal is confirmed by the S&P 500.
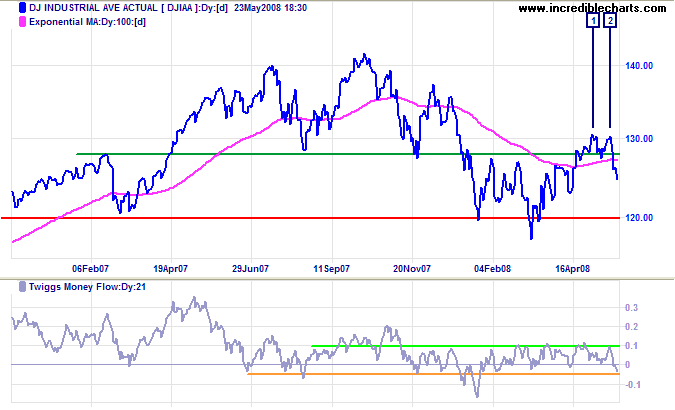
Long Term: Continuation of the primary advance, signaled by recovery above 13000, is now unlikely. Expect a test of primary support at 11750, especially if a retracement respects the new resistance level at 12750. A Twiggs Money Flow fall below -0.05 would threaten primary support.
S&P 500
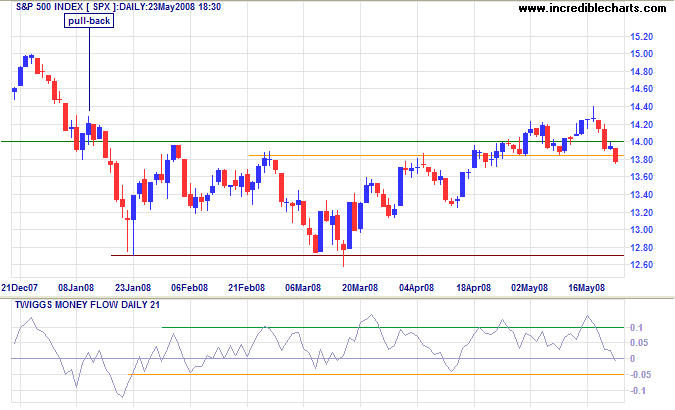
The S&P 500 closed below short-term support at 1385, signaling the start of another correction and a likely test of primary support at 1270. A retracement that respects the new resistance level would confirm the signal. A Twiggs Money Flow fall below -0.05 would threaten primary support.
Transport
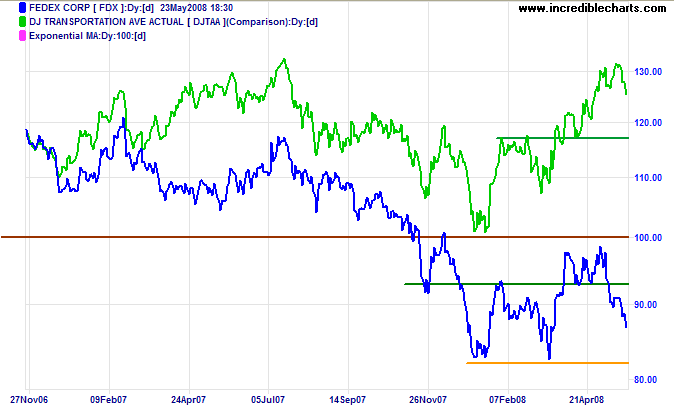
The Dow Transport index reversed at its July 2007 high, while Fedex is headed for a test of primary support at $82 — in response to rising oil prices.
Small Caps
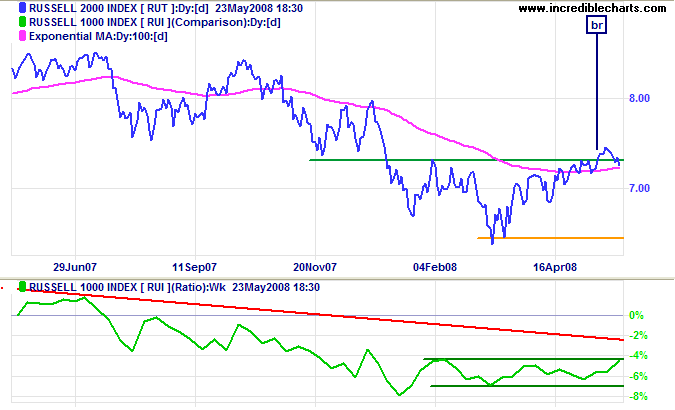
The Russell 2000 Small Caps index also threatens a bull trap, reversing below support at 730. The ratio to the large cap Russell 1000 is rising, but this is unlikely to continue if the bear market revives.
Technology
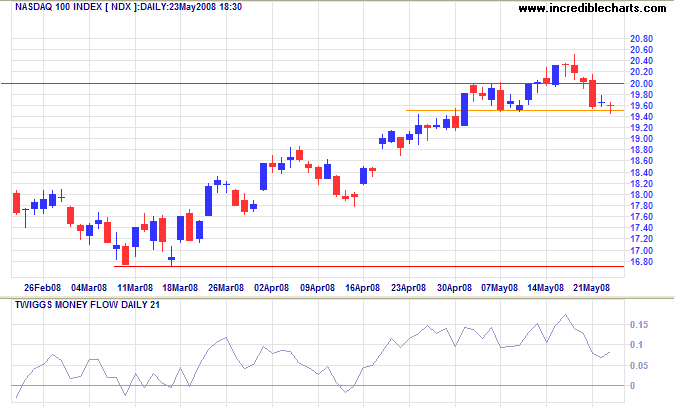
The tech-heavy Nasdaq 100 retreated below 2000, before finding short-term support at 1950. Failure would signal a test of primary support at 1670. Twiggs Money Flow, however, is holding well above zero, indicating longer term buying pressure.
United Kingdom: FTSE
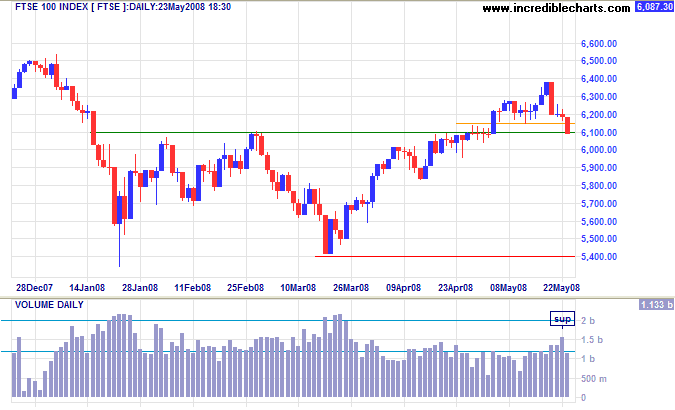
Efforts to support the FTSE 100 at 6200 have failed, over-whelmed by the response to rising oil prices. The close below 6150 warns of a bull trap and a test of primary support at 5400 — confirmed if we see a fall below 6000.
India: Sensex
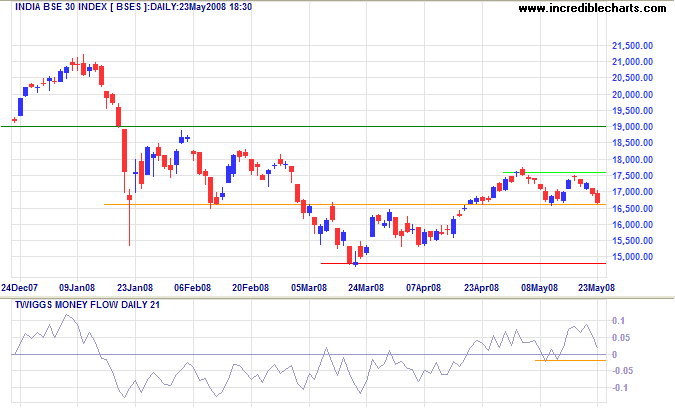
The Sensex is testing support at 16600. Downward breakout would signal a test of 14800, while recovery above 17600 would test 19000. A Twiggs Money Flow fall below -0.02 would warn of selling pressure.
Japan: Nikkei
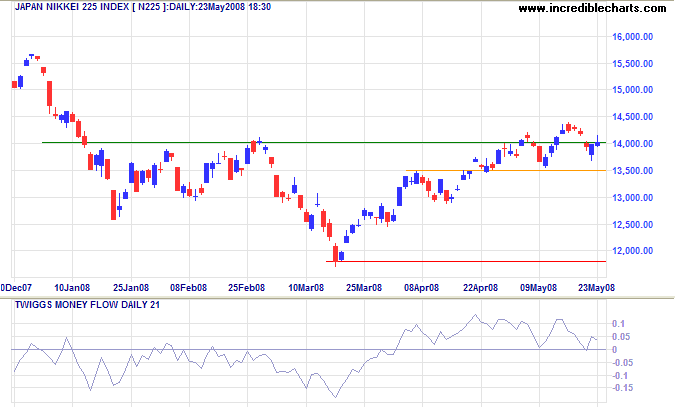
The Nikkei 225 is whipsawing around 14000, indicating uncertainty. Reversal below 13500 would warn of a test of 12000/11750; while recovery above last week's high would confirm the primary advance. Twiggs Money Flow continues to respect the zero line, signaling buying pressure.
China
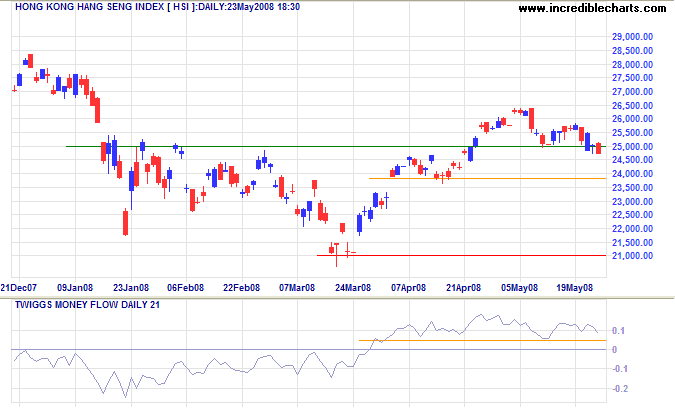
The Hang Seng close below support at 25000 signals weakness, but this is contradicted by the strong reading on Twiggs Money Flow, holding well above zero. Whenever an indicator and the price chart contradict, it is wise to favor the chart. In order to highlight one particular aspect of the chart, an indicator suppresses others — while the price chart reflects all available information.
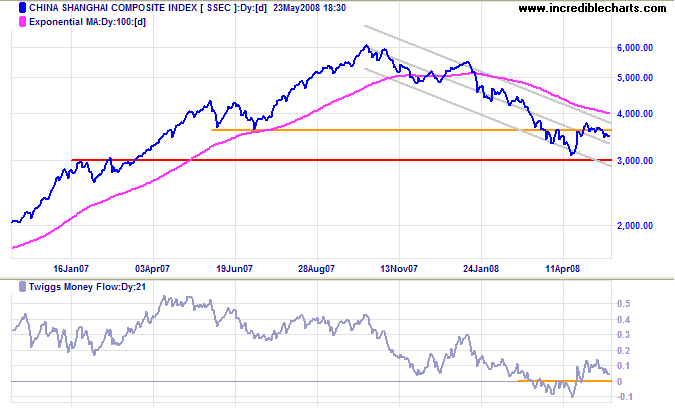
The Shanghai Composite is whipsawing around support at 3500. A close below 3400 would warn of another test of 3000, while recovery above 3700 would test the upper trend channel. A Twiggs Money Flow reversal below zero would signal selling pressure.
Australia: ASX
The All Ordinaries over-whelmed support at 5900, and is headed for a test of 5700. Retracement that respects the new resistance level would confirm this.
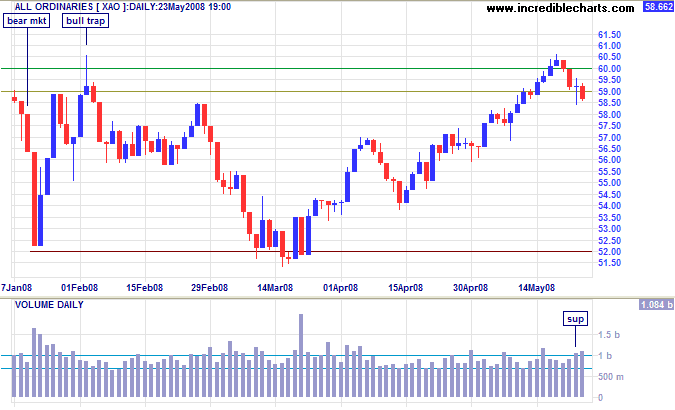
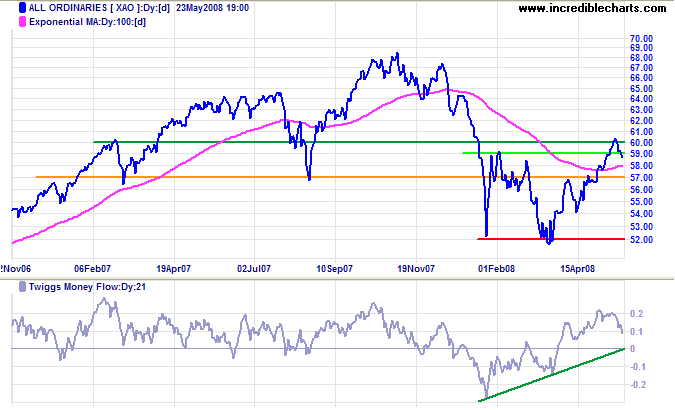
Long Term: Reversal above 6000 is unlikely at present — and would signal a primary up-trend. Penetration of 5700 would indicate a test of primary support at 5200. A Twiggs Money Flow fall below zero would warn of selling pressure.
The only things worth learning are the things you learn after you know it all.
~ Harry S Truman.
To understand my approach, please read About The Trading Diary.

Author: Colin Twiggs is a former investment banker with almost 40 years of experience in financial markets. He co-founded Incredible Charts and writes the popular Trading Diary and Patient Investor newsletters.
Using a top-down approach, Colin identifies key macro trends in the global economy before evaluating selected opportunities using a combination of fundamental and technical analysis.
Focusing on interest rates and financial market liquidity as primary drivers of the economic cycle, he warned of the 2008/2009 and 2020 bear markets well ahead of actual events.
He founded PVT Capital (AFSL No. 546090) in May 2023, which offers investment strategy and advice to wholesale clients.
