Markets On A String
By Colin Twiggs
May 17, 4:00 a.m. ET (6:00 p.m. AET)
These extracts from my trading diary are for educational purposes and should not be interpreted as investment or trading advice. Full terms and conditions can be found at Terms of Use.
Market Intervention
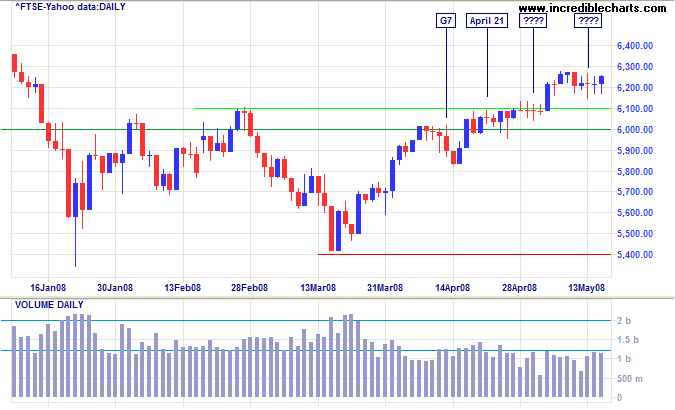
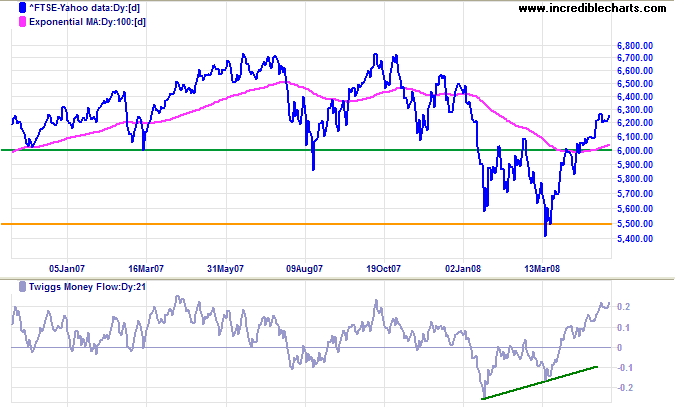
Earlier in the week, while conceding that there was clear evidence of central bank intervention in the currency markets, I dismissed intervention in the stock markets as fanciful. Now I am not so sure. There are no signs of anything untoward on the Dow, apart from the index rising on suspiciously low volumes. However, there are clear signs of co-ordinated support on the FTSE 100 — while volumes, again, are unusually low. The market normally has a pulse, ebbing and flowing every few days, even when in a narrow consolidation. From April 21, the pulse disappeared, with the index flat-lining at fixed levels of 6050, then 6090, then 6200. That is a decidedly odd pattern for a market index and is normally encountered in currency or treasury markets when there is central bank intervention.
The German Dax displays a similar haircut when the market tested support at 7000.
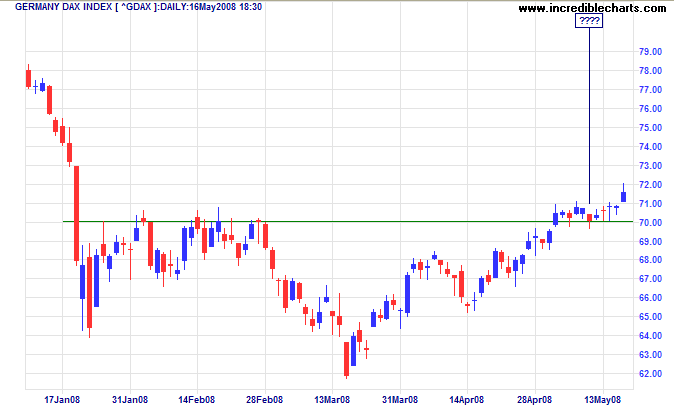
None of this is hard evidence, but it is suspicious. If true, one thing you can be sure of is that the purpose is not to protect the small investor — but to save the financial sector from their excesses. Short-term traders would welcome any such intervention: they basically get a free ride for as long as the safety net is in place. The problem is: how far will the market correct when the safety net is removed? Long-term investors should bear in mind that current activity is most likely a continuation of the market top, rather than commencement of a new bull market.
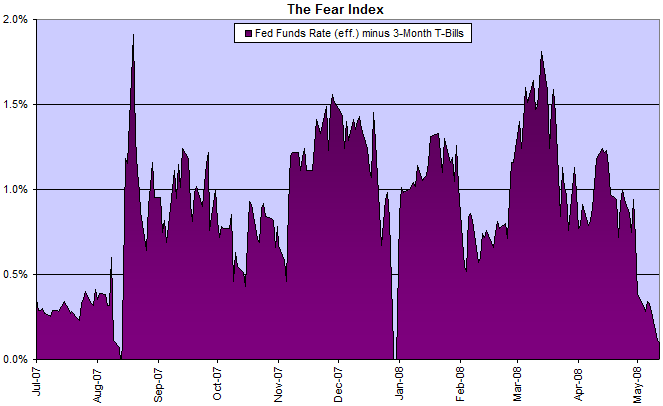
We often read of the efficient market theory, where price reflects all information available to market participants. At times I get the feeling that the market is driven more by the collective interest of participants than by information. Supporters of the theory may find it difficult to explain what drove the Dow to a new high in October 2007, two months after the break of the sub-prime crisis — when the fear index (below) had spiked into the red zone (above 1.0%).
USA
The Fear Index
Confidence in financial markets is returning, with the fear index (the spread between the fed funds rate and 3-month treasury bills) falling to near zero.
Dow Jones Industrial Average
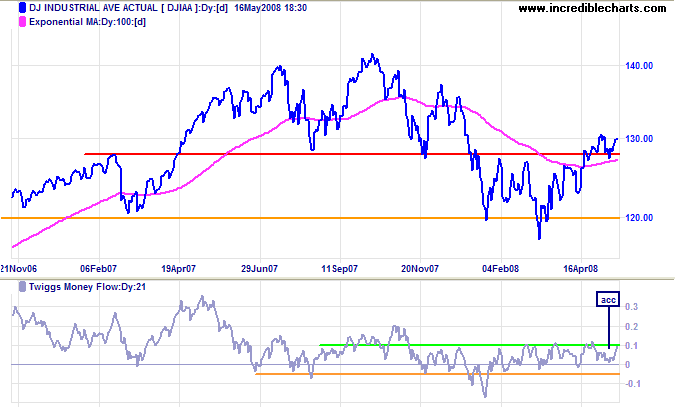
The Dow is rising on unusually low volumes, respecting support at 12800 before again testing resistance at 13000. Higher volume on days with longish tails indicates buying support and we are likely to see a continuation of the up-trend. The signal is confirmed by the S&P 500.
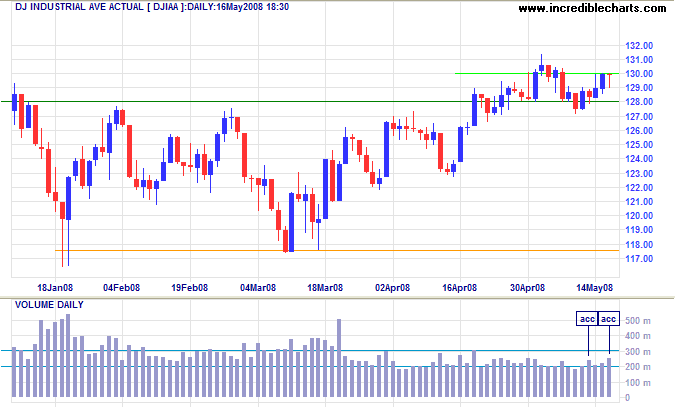
Long Term: Respect of support at 13000 offers a target of 14000 for the primary advance. Reversal below 13000, while unlikely, would warn of another test of 12000. Twiggs Money Flow respect of the zero line signals buying pressure.
S&P 500
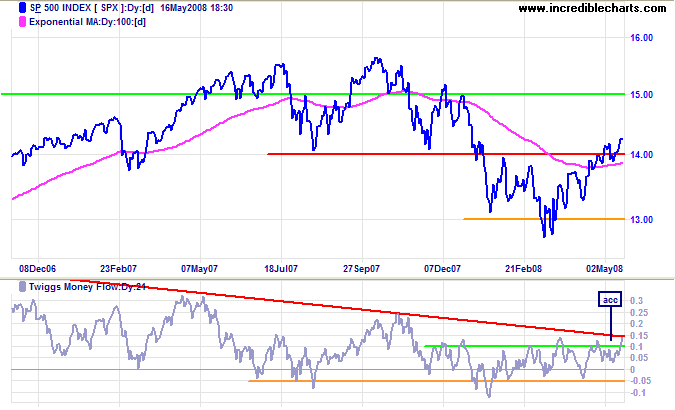
The S&P 500 respected the new support level at 1400, offering a target of 1500 for the primary advance. Reversal below 1400 is unlikely and would signal a test of 1300. Twiggs Money Flow trough above zero confirms buying pressure.
Transport
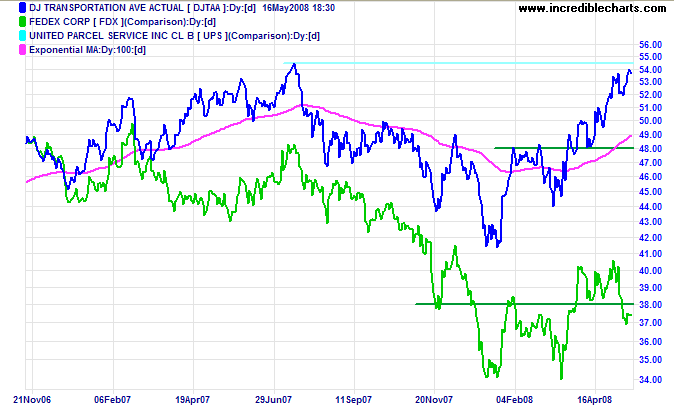
The Dow Transport index is advancing strongly to test the July 2007 high. Fedex, however, is weakening in reaction to record oil prices. Respect of the new resistance level (at $93.00) would signal a test of primary support (at $82.00). Conflicting signals for the broader economy.
Small Caps
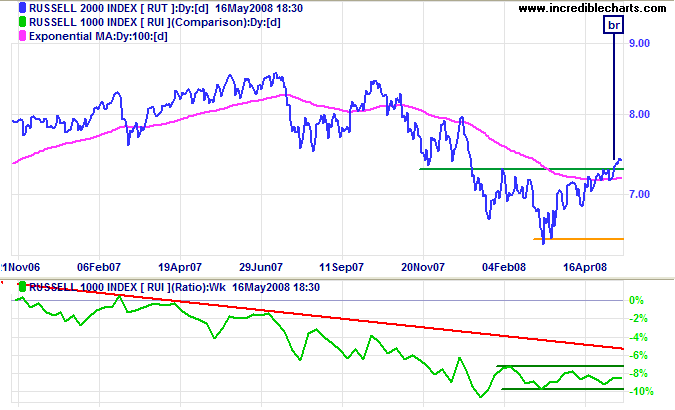
The Russell 2000 Small Caps index broke through resistance at 730, starting a primary up-trend. The ratio to the large cap Russell 1000 has leveled off after a two-year decline, indicating that flight to relative safety of large cap stocks has halted.
Technology
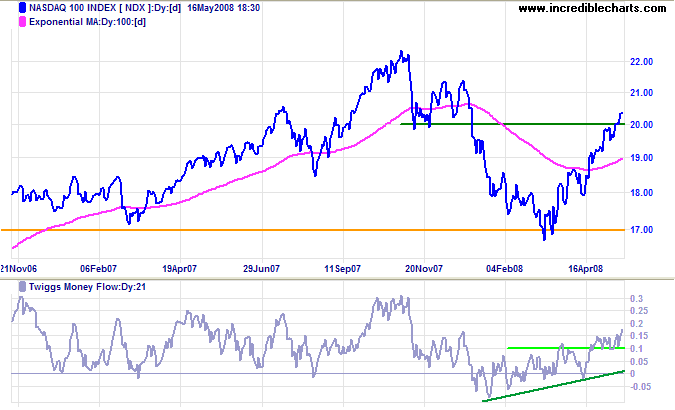
The tech-heavy Nasdaq 100 broke through resistance at 2000, offering a target of 2200 for the next advance. Expect retracement to confirm the new support level in the short-term. Twiggs Money Flow holding above 0.1 signals strong buying pressure.
United Kingdom: FTSE
Short-term traders would welcome signs of recent intervention on the FTSE 100, but it clouds the long-term view. Expect an advance to test 6750, followed by a sharp correction if market support is withdrawn.
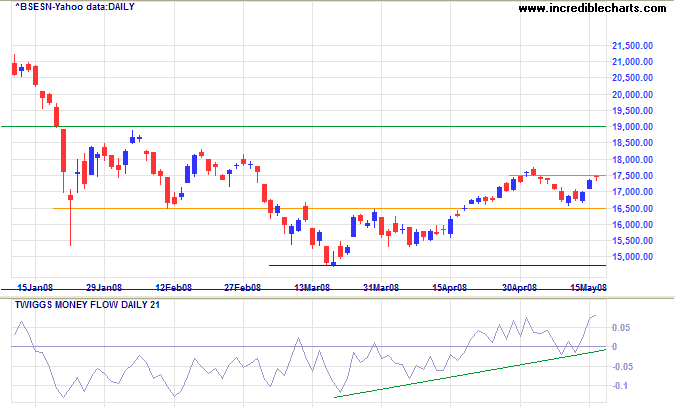
India: Sensex
The Sensex respected support at 16500 and a break of resistance at 17500 would signal a test of 19000. Twiggs Money Flow oscillating above the zero line reflects buying pressure.
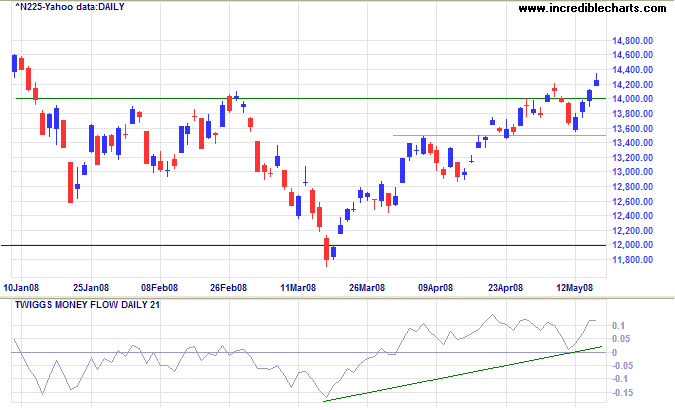
Japan: Nikkei
The Nikkei 225 respected short-term support at 13500, before recovering above 14000 to confirm the primary up-trend. The trough on Twiggs Money Flow respected the zero line, indicating sustained buying pressure.
China
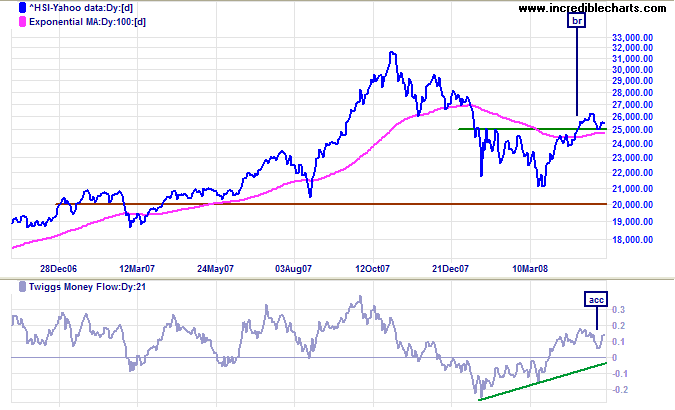
The Hang Seng respected the new support level at 25000 to confirm the primary up-trend. The long-term target is last year's high at 31500. Failure of 25000 is now unlikely and would warn of a test of primary support at 21000. Twiggs Money Flow oscillating above zero reflects continued buying pressure.
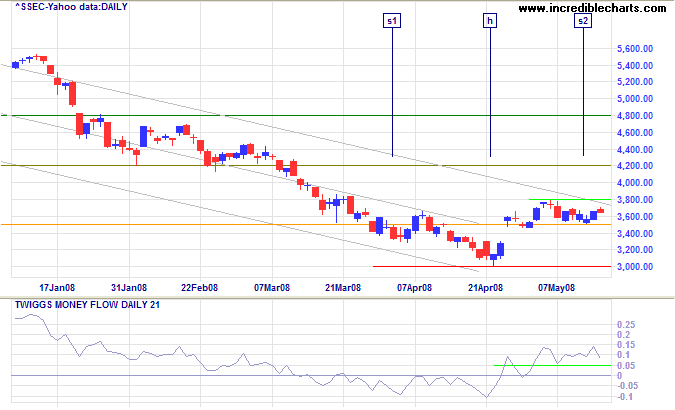
The Shanghai Composite found support at 3500. Breakout above 3800 would complete an inverted head and shoulders pattern, with a target of 3800+(3800-3000)=4600, as well as piercing the upper trend channel. Failure of 3500 seems unlikely and would signal a test of 3000. Twiggs Money Flow holding above the zero line signals buying pressure.
Australia: ASX
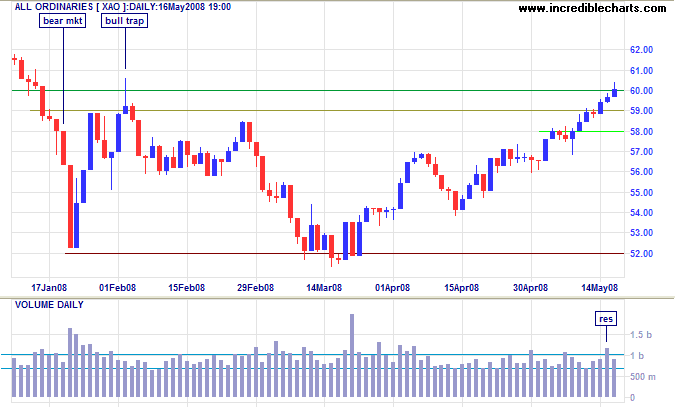
Tall shadows and higher volume reflect profit-taking as the All Ordinaries approaches primary resistance at 6000. Reversal below 5700 is not expected, and would warn of a test of 5200.
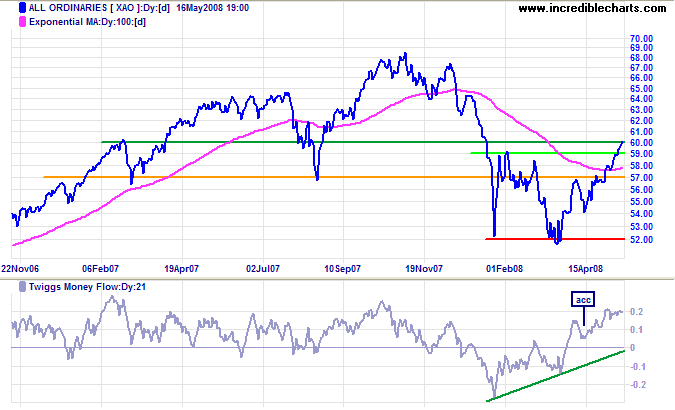
Long Term: Breakout above 6000 would commence a primary up-trend, with an initial target of 6800. Rising Twiggs Money Flow reflects strong buying pressure.
I never did give anybody hell. I just told the truth and they thought it was hell.
~ Harry S Truman.
To understand my approach, please read About The Trading Diary.

Author: Colin Twiggs is a former investment banker with almost 40 years of experience in financial markets. He co-founded Incredible Charts and writes the popular Trading Diary and Patient Investor newsletters.
Using a top-down approach, Colin identifies key macro trends in the global economy before evaluating selected opportunities using a combination of fundamental and technical analysis.
Focusing on interest rates and financial market liquidity as primary drivers of the economic cycle, he warned of the 2008/2009 and 2020 bear markets well ahead of actual events.
He founded PVT Capital (AFSL No. 546090) in May 2023, which offers investment strategy and advice to wholesale clients.
