Is A Recovery Likely?
By Colin Twiggs
April 26, 12:30 a.m. ET (4:30 p.m. AET)
These extracts from my trading diary are for educational purposes and should not be interpreted as investment or trading advice. Full terms and conditions can be found at Terms of Use.
I have combined the normal yields & spreads (Thursday) and stock markets (Saturday) newsletters because of the ANZAC Day long weekend.
Recoveries And Inflation
Investors may wonder how the market can possibly rally when the economy resembles a punch-drunk boxer hanging on the ropes. The answer is fairly simple: the big money is not betting on the economy it is betting on inflation.
The Fed is printing money as fast as it can — in order to save the banking system from annihilation. Nobody gets up off the canvas without assistance after taking a 1 trillion dollar sock on the jaw. While the Fed can provide liquidity, there is only one way to protect banks from falling asset prices which threaten to wipe out their reserves. That is to create inflation — to reverse the fall in asset prices.
Investors and financial markets response to low interest rates from the Fed is to borrow all that they can and invest in real assets in anticipation of rising prices. This becomes a self-fulfilling prophecy as demand for real assets exceeds supply, driving up prices.....and the next asset bubble is born.
The Fed does not mind, as investors mop up surplus money in the system and prevent it from flowing through to consumption — where it would affect consumer prices. Economists thought that they had found the holy grail. They could stimulate the economy without any significant impact on consumer prices. Only to discover that it is a poison chalice. There is no quarantine fence around asset bubbles and eventually higher asset prices flow through to consumers. When average workers can no longer afford to buy their own home, upward pressure on wages starts to rise. And when asset bubbles burst, as they are prone to, causing severe shocks to the economy, the Fed's only available response is to..... you guessed it ....... print more money and start the next asset bubble. The ever-increasing shocks are eroding the ability of the economy to recover and grow in a stable, predictable environment.
So where is the next asset bubble likely to occur? With wounds from collapse of the housing bubble still fresh, there are only two viable alternatives: stocks and commodities.
Inflation targeting by central banks is a major cause of bubbles. Inflation targeting is based on CPI which is a poor measure of the loss of purchasing power of the dollar. Why have house prices doubled in the last 5 years if inflation is averaging between 2 and 3 percent? Not to mention gold, oil and most other commodities. By using CPI as a measure, the Fed responds to crises long after the real damage is caused. Ever tried to steer your car while looking through the rear window to see where you are going? No wonder the Fed crashes into the sidewalk every time they encounter a bend in the road.
If you believe this is all too complicated and best left to a bunch of academic economists and self-interested bankers to sort out, allow me to remind you that the definition of stupidity is to repeat the same action and expect a different result.
If you agree with this opinion, please share it with your friends and colleagues.
USA
The University of Michigan reported that consumer sentiment fell to 62.6, the lowest level since 1982.

Dow Jones Industrial Average
The Dow retreated on Friday morning but rallied towards the close, ending near the day's high at 12900. Failure to react to bad news is a bullish sign — as is a short retracement at the resistance line (12800). Low volumes, however, indicate that the rally does not result from buying pressure, but rather from the absence of sellers — warning us to proceed with caution.

Long Term: The index is headed for a test of previous highs at 14000 — which may result in a volatile, wide-ranging top similar to 1999 - 2001. Wait for a breakout on the S&P 500 to confirm the signal. Twiggs Money Flow signals medium-term accumulation.

S&P 500
The S&P 500 is testing resistance at 1400. Breakout would offer a medium-term target of 1500 — and confirm the Dow Industrial and Transport Averages signal. Twiggs Money Flow trough high above zero indicates strong short-term buying pressure.

Yields & Rates
Three-month treasury yields are consolidating. Breakout above 1.50% would signal increasing stability, while a fall below 1.0% would warn of further risk aversion from investors. The fall below 2.0% in the effective fed funds rate confirms the general market view that the target rate will be cut by at least a quarter-percent. The spread between commercial paper and the fed funds rate indicates continuation of the credit squeeze: no spread is normally evident in a stable market (as in July 2007).

The differential between the fed funds rate and 3-month T-bills has fallen to below 1.0% and is now in the amber (0.5% to 1.0%) range, indicating that markets have stabilized — at least in the short term.

United Kingdom: FTSE
The FTSE 100 held above its new support level at 6000. A break through 6100 would confirm a test of the previous highs at 6700 in the medium-term. Twiggs Money Flow signals buying pressure.

India: Sensex
Having broken above 17000, the Sensex is headed for a test of 19000. Twiggs Money Flow crossed to above the zero line, signaling short-term buying pressure.

Japan: Nikkei
The Nikkei 225 is testing resistance at 14000. Breakout would signal reversal to a primary up-trend. Twiggs Money Flow confirms strong buying pressure.

China
The Shanghai Composite found support at 3000 before gapping up to test short-term resistance at 3600. Short-term support is at 3300: the lower end of the gap. Expect a test of the upper trend channel. Twiggs Money Flow crossed above zero and a retracement that respects the zero line would confirm buying pressure.

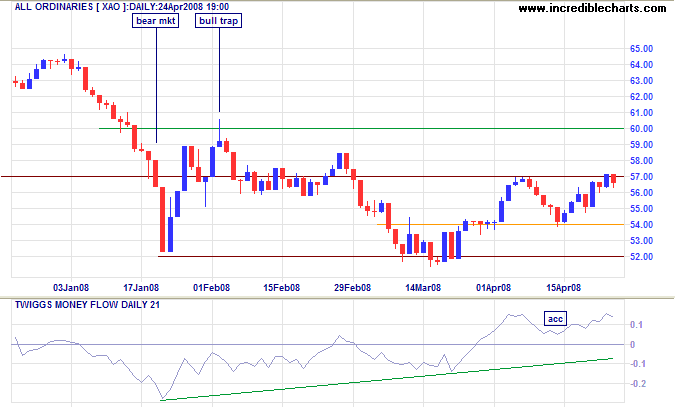
Australia: ASX
The All Ordinaries is testing resistance at 5700. Expect a breakout on positive sentiment in other markets — and a test of 6000. Reversal above 6000 would signal a primary up-trend.
It was the birth of a nation, and one can only hope that this thought provided some comfort to the parents of the Anzac whose very Australian headstone stands where the first landing took place. It reads:
Died aged 18 near this spot
April 25, 1915
Did his best.
~ Phillip Knightley, Australia: A Biography of a Nation
To understand my approach, please read Technical Analysis & Predictions in About The Trading Diary.

Author: Colin Twiggs is a former investment banker with almost 40 years of experience in financial markets. He co-founded Incredible Charts and writes the popular Trading Diary and Patient Investor newsletters.
Using a top-down approach, Colin identifies key macro trends in the global economy before evaluating selected opportunities using a combination of fundamental and technical analysis.
Focusing on interest rates and financial market liquidity as primary drivers of the economic cycle, he warned of the 2008/2009 and 2020 bear markets well ahead of actual events.
He founded PVT Capital (AFSL No. 546090) in May 2023, which offers investment strategy and advice to wholesale clients.