Dow Finds Support, Shanghai None
By Colin Twiggs
March 29, 2:00 a.m. ET (6:00 p.m. AET)
These extracts from my trading diary are for educational purposes and should not be interpreted as investment advice. Full terms and conditions can be found at Terms of Use.
USA
While Dow large caps, technology and transport stocks show
early signs of a recovery, the broader market
S&P 500 and Russell 2000 remain weak. It is important to
wait for the dust to settle, instead of leaping to conclusions.
We may encounter many
bull traps ahead before there is a true recovery.
International markets are also starting to drag, with the Shanghai index looking particularly weak.
Dow Jones Industrial Average
The Dow is retracing on light volume. Respect of support at 12000 would signal a test of resistance at 12800.
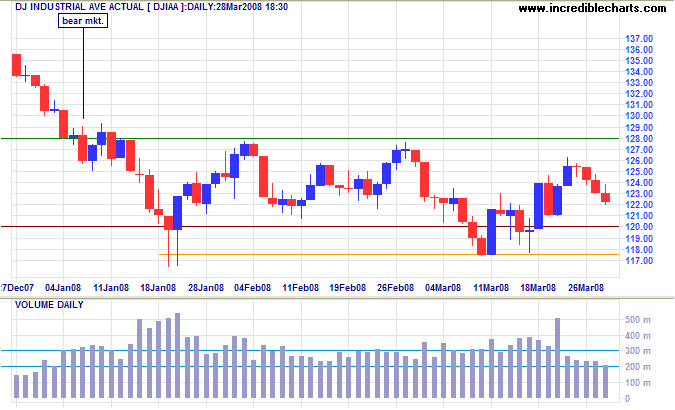
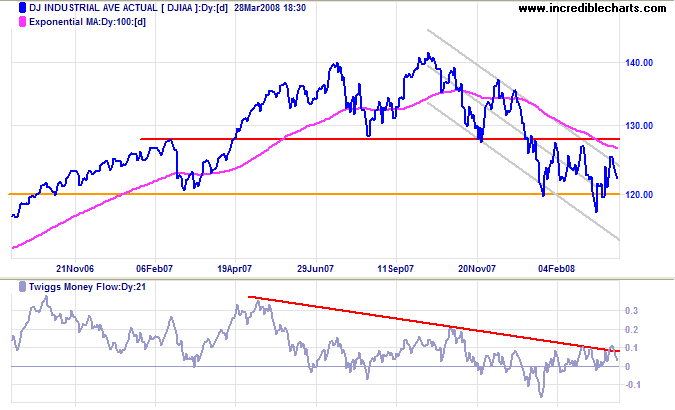
Long Term: Resistance at 12800 is expected to hold because of the bear market. Breakout below support at 11750 would signal another primary decline, with a target of 12000-(12800-12000)=11200. Twiggs Money Flow above zero indicates short-term accumulation, but long-term selling pressure remains.
S&P 500
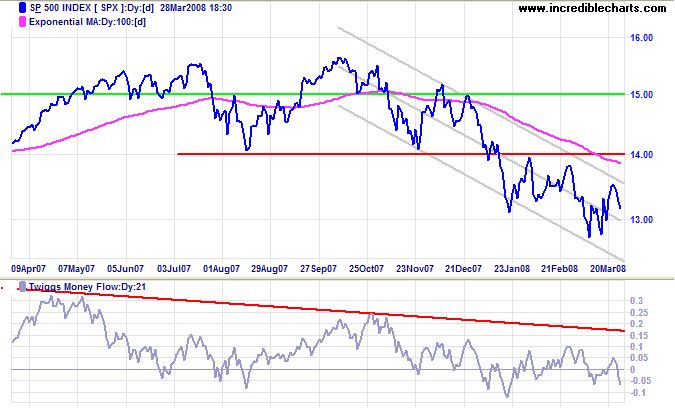
The S&P 500 is headed for another test of support at 1300. Breakout would offer a medium-term target of 1300-(1400-1300)=1200. Twiggs Money Flow reflects long-term selling pressure, with less accumulation than the Dow, as investors seek the relative safety of large cap stocks.
Small Caps
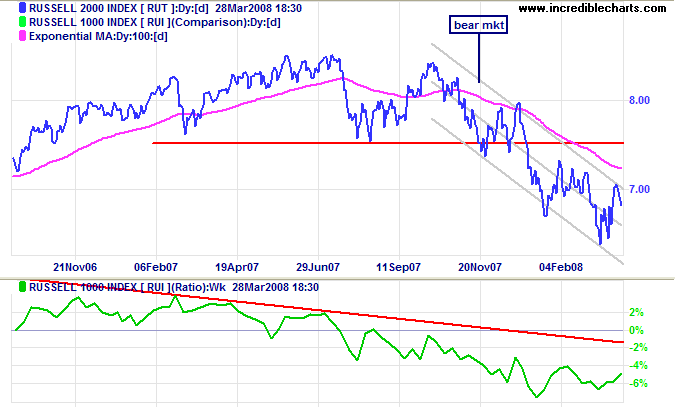
The Russell 2000 encountered resistance at the upper trend channel and is now headed for a test of the lower channel, with a target of 650-(750-650)=550. The falling ratio against the Russell 1000 shows migration to the relative safety of larger cap stocks.
Technology
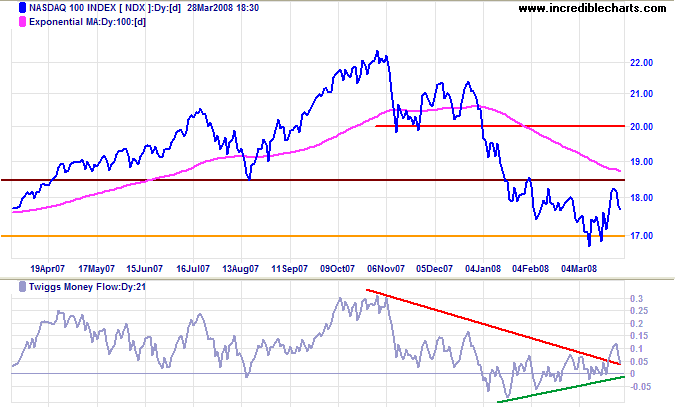
Technology stocks are also in favor, with the Nasdaq 100 finding support at 1700. Rising Twiggs Money Flow signals accumulation. Recovery above 1850 would be a positive sign, but we are in a bear market and breakout below 1700 remains as likely, offering a target of 1450 (the July 2006 low).
Transport
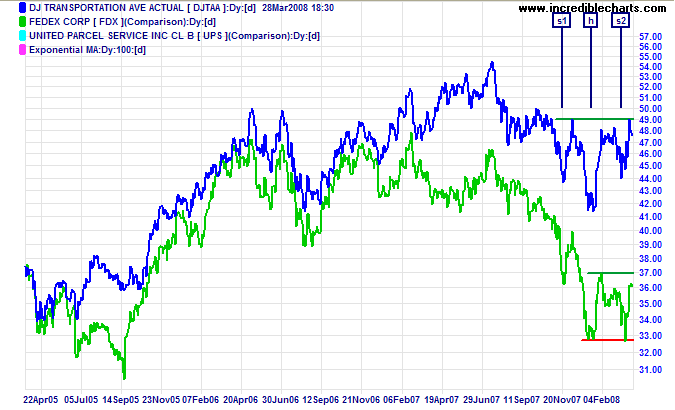
A Dow Jones Transportation Average breakout above 4900 would complete an inverted head and shoulders formation, with a target of the July 2007 high. Lead indicator Fedex is similarly close to completing a double bottom. Breakout above $94.00 (scale not shown) would signal a primary trend reversal — but beware of false breaks.
United Kingdom: FTSE
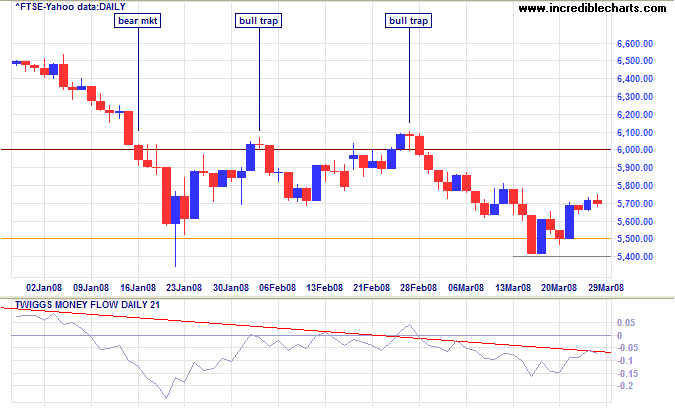
The FTSE 100 is advancing on low volume and is unlikely to break 6000. Twiggs Money Flow remains below zero, signaling strong selling pressure. Failure of support at 5400 would confirm the (medium-term) target of 5500-(6000-5500)=5000.
India: Sensex
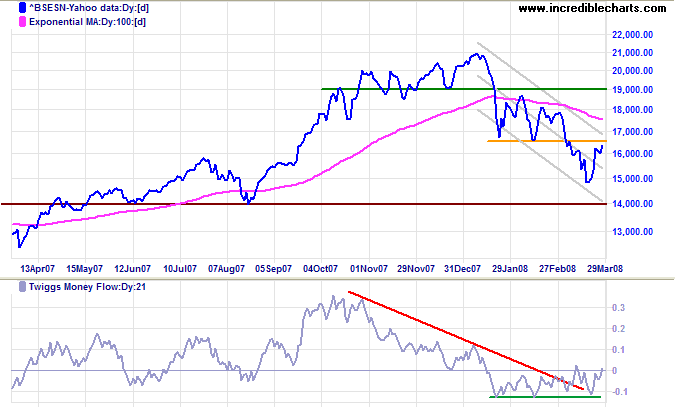
The Sensex retraced to test resistance at 16500. Respect of the upper trend channel would signal another decline to test support at 14000, the August 2007 low. Twiggs Money Flow holding below zero indicates continued selling pressure.
Japan: Nikkei
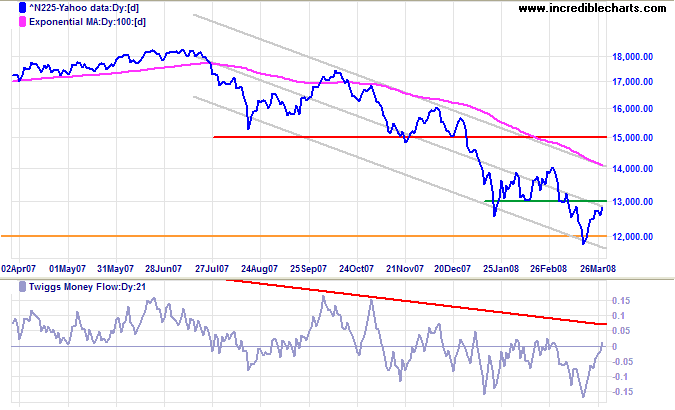
The Nikkei 225 retraced to resistance at 13000. Breakout would signal a test of the upper trend channel, while respect would mean another test of 12000. Twiggs Money Flow holding below zero indicates strong selling pressure — the primary down-trend continues.
China: Hang Seng & Shanghai
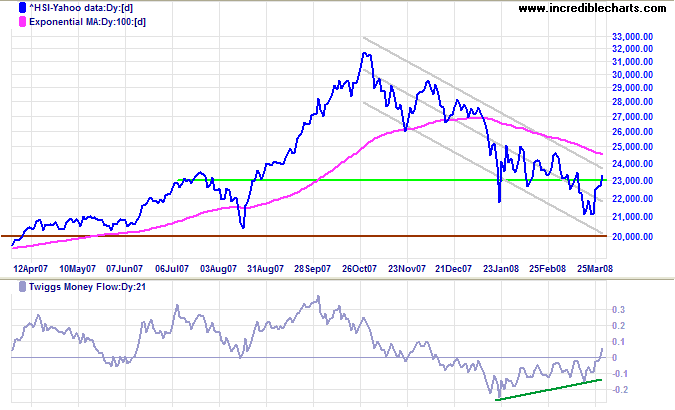
The Hang Seng looks reasonably strong: testing the upper trend channel while rising Twiggs Money Flow signals buying pressure. Breakout above the trend channel would warn that the down-trend is weakening.
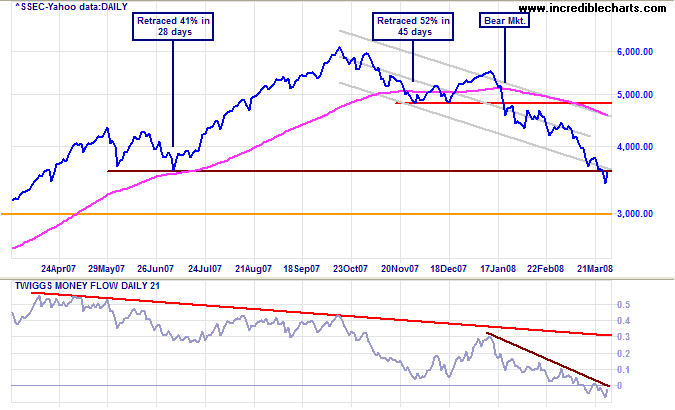
The Shanghai Composite, on the other hand, broke through support at 3600 — and the lower trend channel. Declining Twiggs Money Flow warns of strong (long and short-term) selling pressure. The index has a tendency to decline in steps of 1200 with reactions of 600: 6000...4800...5400...4200... but the reaction to 4800 failed to materialize and the down-trend is accelerating. If the latest pull-back respects the new resistance level at 3600, the next decline should reach 3000; possibly even 2400.
Australia: ASX
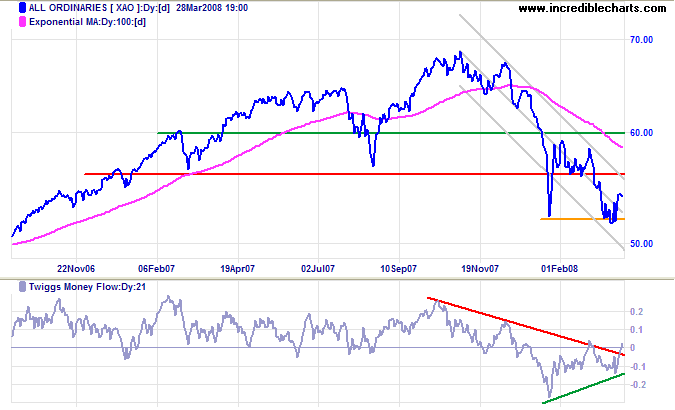
The All Ordinaries found support at 5200. Strong volume at [1] and [2] on red candle days and a long tail at [2] signals buying pressure. Expect a rally to test resistance at 5900/6000.
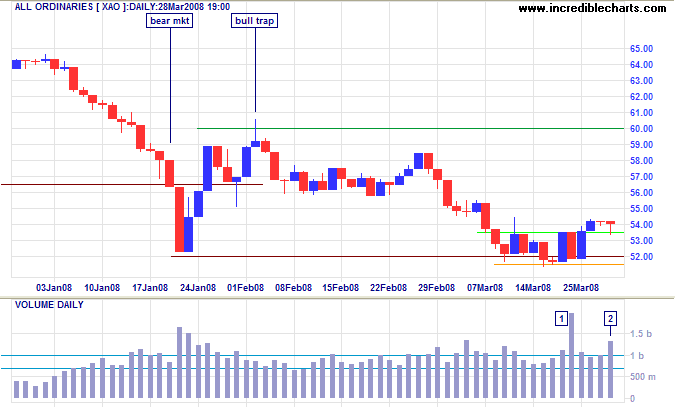
Long Term: Resistance at 6000 is likely to hold because of the bear market. Breakout below 5200 would confirm another primary decline, testing support at the June 2006 low of 4800. Twiggs Money Flow below zero signals long-term selling pressure, while the rising green trendline indicates short-term accumulation.
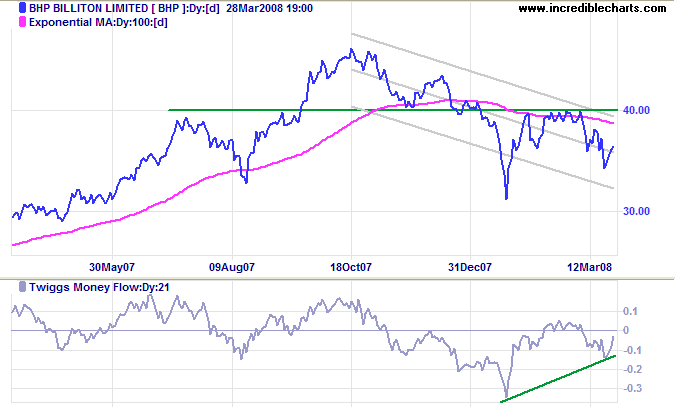
While still in a down-trend, resources stocks show signs of accumulation. BHP displays a rising trendline on Twiggs Money Flow. The key resistance level remains at $40.00.
It may be true that you can't fool all the people all the
time,
but you can fool enough of them to rule a large country.
~
Will Durant
To understand my approach, please read Technical Analysis & Predictions in About The Trading Diary.

Author: Colin Twiggs is a former investment banker with almost 40 years of experience in financial markets. He co-founded Incredible Charts and writes the popular Trading Diary and Patient Investor newsletters.
Using a top-down approach, Colin identifies key macro trends in the global economy before evaluating selected opportunities using a combination of fundamental and technical analysis.
Focusing on interest rates and financial market liquidity as primary drivers of the economic cycle, he warned of the 2008/2009 and 2020 bear markets well ahead of actual events.
He founded PVT Capital (AFSL No. 546090) in May 2023, which offers investment strategy and advice to wholesale clients.
