Dow Breaks Support
By Colin Twiggs
March 8, 12:00 a.m. ET (4:00 p.m. AET)
These extracts from my trading diary are for educational purposes and should not be interpreted as investment advice. Full terms and conditions can be found at Terms of Use.
USA
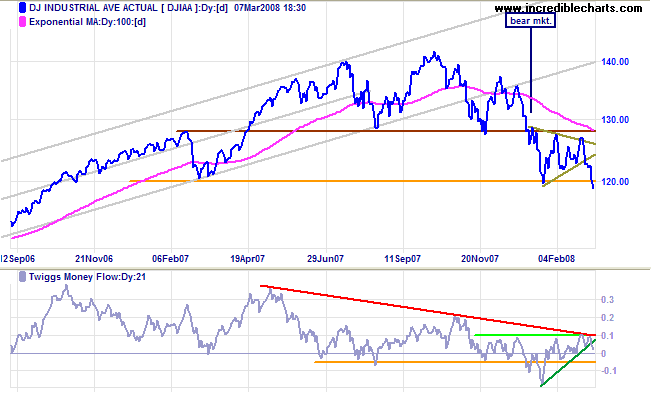
Dow Jones Industrial Average
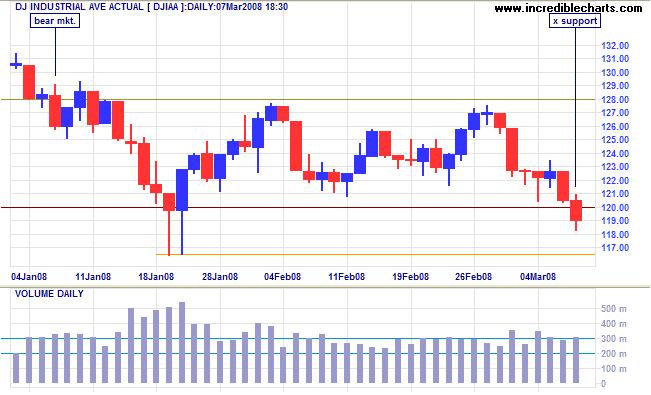
The Dow broke support at 12000, signaling the start of another downward leg in the bear market. The medium-term target is 12000-(12800-12000)=11200. Twiggs Money Flow signals that short-term accumulation has ended and long-term selling pressure prevails.
Short Term: Expect short-term support at the January intra-day low of 11650, but this is unlikely to hold.
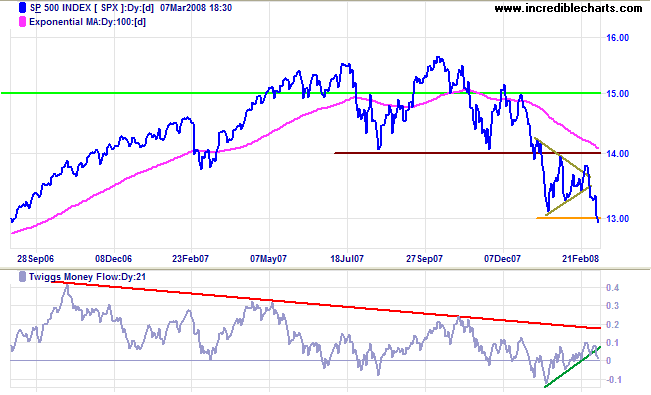
S&P 500
The S&P 500 confirms the Dow signal, with a break through support at 1300. The medium-term target is 1300-(1400-1300)=1200.
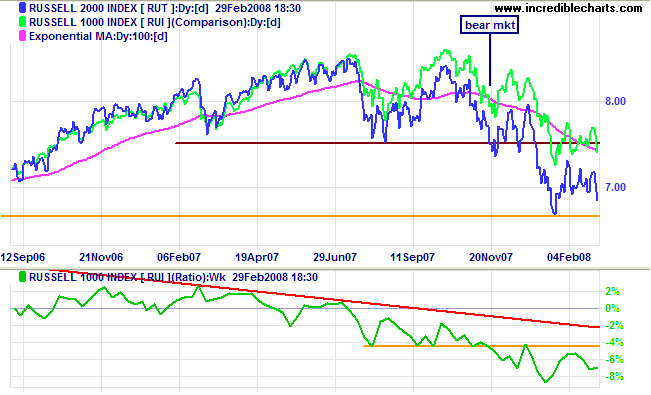
Small Caps
The Russell 2000 broke through support at 670/650, signaling another down-swing with a target of 650-(750-650)=550. Migration to the relative safety of large cap stocks continues, signaled by the falling ratio against the Russell 1000.
Technology
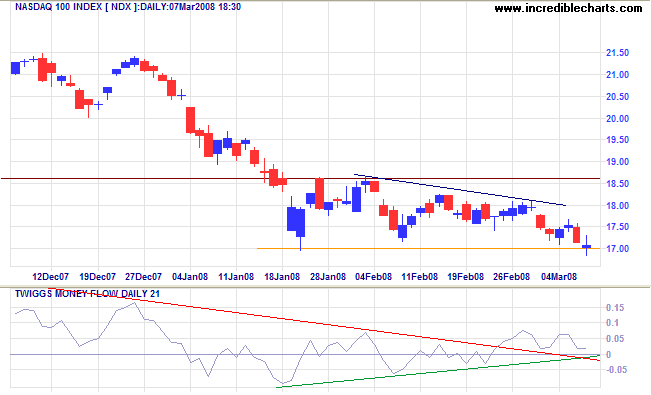
The Nasdaq 100 is testing support at 1700, the lower border of the last 6 weeks consolidation. Breakout would signal another (primary) down-swing with a target of 1450 — the July 2006 low. Twiggs Money Flow indicates medium-term accumulation. It is ironic that the market now perceives technology stocks as a relatively safe haven.
Transport
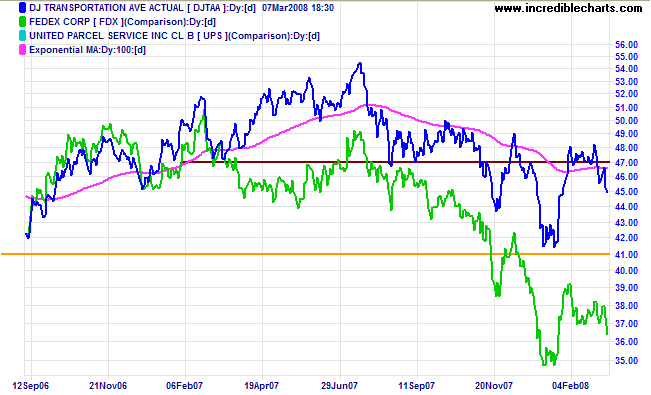
The Dow Jones Transportation Average is headed for another test of 4100. The primary down-trend continues.
United Kingdom: FTSE
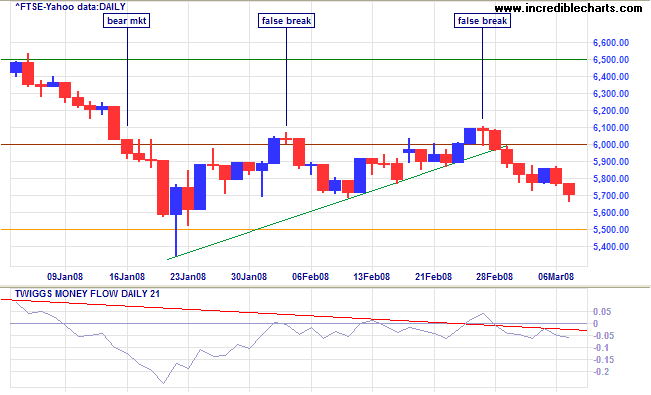
The FTSE 100 is headed for a test of support at 5500. Long candlestick tails indicate the presence of buyers, but Twiggs Money Flow below zero warns that sellers remain dominant. Failure of support at 5500 would offer a (medium-term) target of 5500-(6000-5500)=5000.
India: Sensex
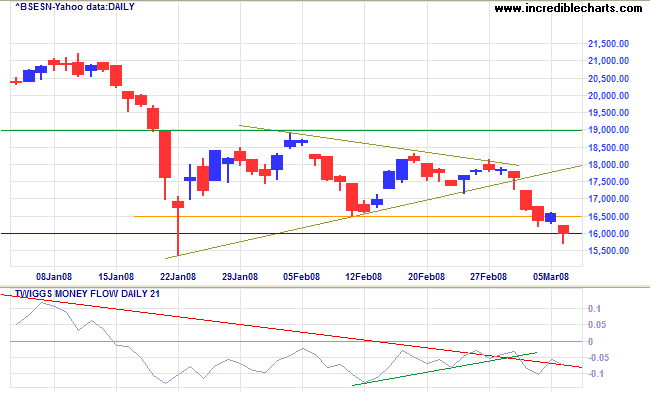
The Sensex broke through support at 16500, offering a target of 16500-(19000-16500)=14000, its August 2007 low. Twiggs Money Flow signals that short-term accumulation has ended and long-term selling pressure prevails.
Japan: Nikkei
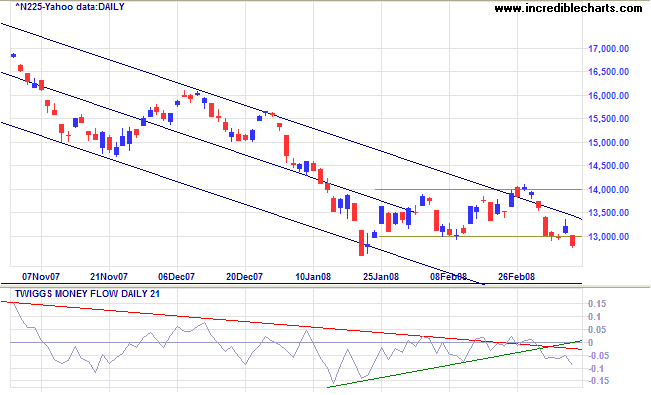
The Nikkei 225 broke through support at 13000 and is headed for a test of the original (2005) breakout level at 12000. Twiggs Money Flow indicates that short-term accumulation has ended and long-term selling pressure prevails.
China: Hang Seng & Shanghai
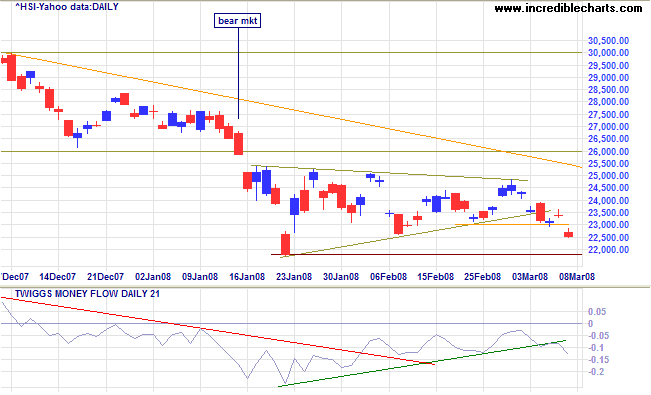
The Hang Seng broke through short-term support at 23000 after completing a symmetrical triangle and is headed for a test of medium-term support at 21800/22000. Breakout would offer a target of 20000 (from August 2007). Twiggs Money Flow breaking the green trendline shows that short-term accumulation has ended.
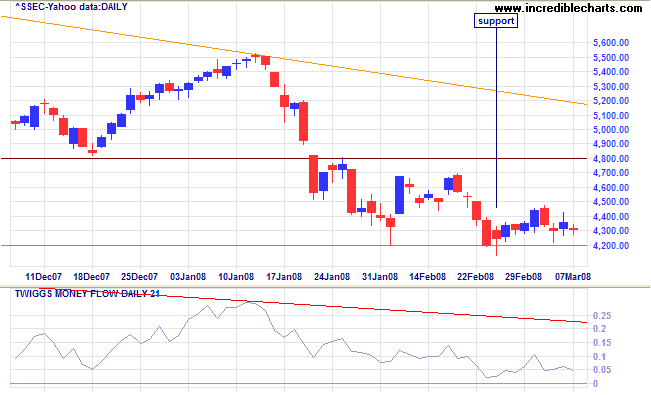
The Shanghai Composite continues to hold above support at 4200, with long candlestick tails indicating the presence of buyers. Twiggs Money Flow respecting the zero line signals short-term accumulation, but the (red) long-term trendline indicates selling pressure. The primary down-trend is expected to continue and downward breakout would offer a target of 3600 (from July 2007). Recovery above 4450, on the other hand, would mean a test of 4800.
Australia: ASX
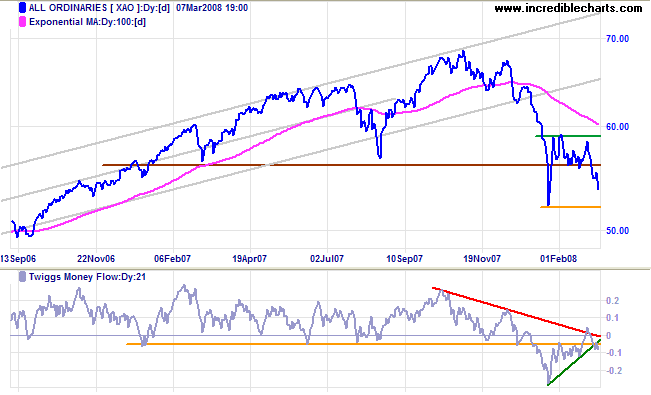
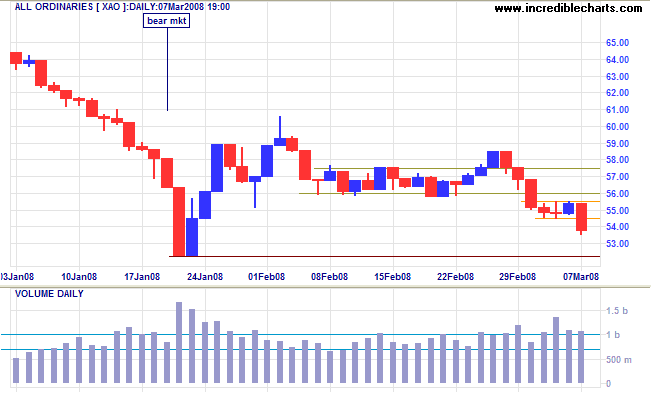
The All Ordinaries continues in a primary down-trend,
susceptible to bearish influences from international markets.
Breakout below 5600 warns of another decline; the long-term
target is 4800 — from June 2006.
Twiggs Money Flow shows short-term accumulation has ended
and long-term selling pressure prevails.
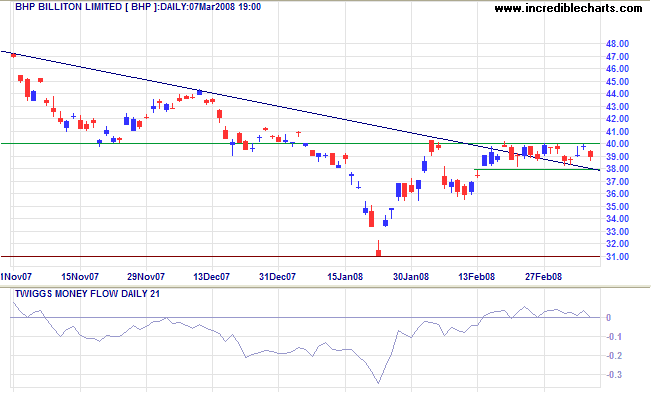
Bullish forces in the mining/resources sector are subdued at present, but BHP continues to consolidate below $40.00 in a narrow rectangle, promising a resurgence.
Short Term: The All Ords broke through support at 5600 and is headed for a test of the January low at 5200. Narrow consolidation accompanied by large volumes, show how sellers over-whelmed an attempted mid-week rally.
It's a recession when your neighbor loses his job;
it's a depression when you lose yours.
~
Harry S. Truman
To understand my approach, please read Technical Analysis & Predictions in About The Trading Diary.

Author: Colin Twiggs is a former investment banker with almost 40 years of experience in financial markets. He co-founded Incredible Charts and writes the popular Trading Diary and Patient Investor newsletters.
Using a top-down approach, Colin identifies key macro trends in the global economy before evaluating selected opportunities using a combination of fundamental and technical analysis.
Focusing on interest rates and financial market liquidity as primary drivers of the economic cycle, he warned of the 2008/2009 and 2020 bear markets well ahead of actual events.
He founded PVT Capital (AFSL No. 546090) in May 2023, which offers investment strategy and advice to wholesale clients.
