Low Rates Are Inevitable
By Colin Twiggs
March 1, 1:00 a.m. ET (5:00 p.m. AET)
These extracts from my trading diary are for educational purposes and should not be interpreted as investment advice. Full terms and conditions can be found at Terms of Use.
USA
The financial sector faces a solvency crisis caused by declining asset prices — initially the housing market, but subsequently spreading to other asset classes such as stocks and commercial real estate. The situation is further complicated by counter-party risk, where institutions who hedged their positions now find that insurers at the other end of the hedge transaction are at risk of default — leaving them totally exposed.
Brad DeLong at Economist's View describes the problem facing the Fed:
This kind of crisis cannot be solved simply by ensuring that
solvent borrowers can borrow, because the problem is that banks
aren't solvent at prevailing interest rates. Banks are highly
leveraged institutions with relatively small capital bases, so
even a relatively small decline in the prices of assets that
they or their borrowers hold can leave them unable to pay off
depositors, no matter how long the liquidation process.
....But if the central bank reduces interest rates and credibly
commits to keeping them low in the future, asset prices will
rise.
The obvious path is for the Fed to maintain low interest rates until asset prices recover. Unfortunately, while this would rescue the financial system, it is likely to cause an inflation spike. Creating an asset bubble to bail out the banks will inevitably lead to another collapse when artificially low interest rates are allowed to rise.
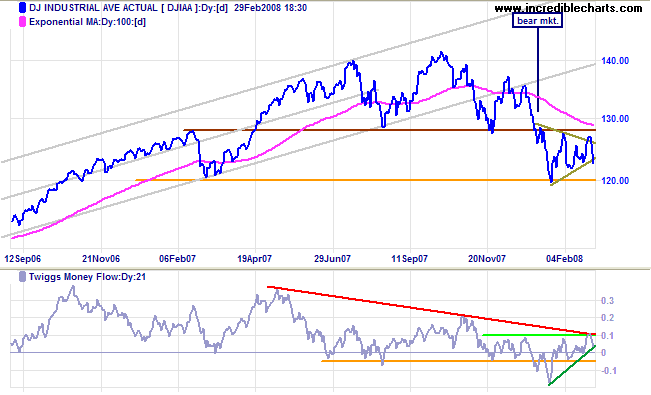
Dow Jones Industrial Average
The bear market continues. The Dow broke down from its triangle, but only in the last third of the formation, reducing the reliability of the signal. Breakout below 12000 would confirm the medium-term target of 12000-(12800-12000)=11200. Twiggs Money Flow signals short-term accumulation but long-term selling pressure.
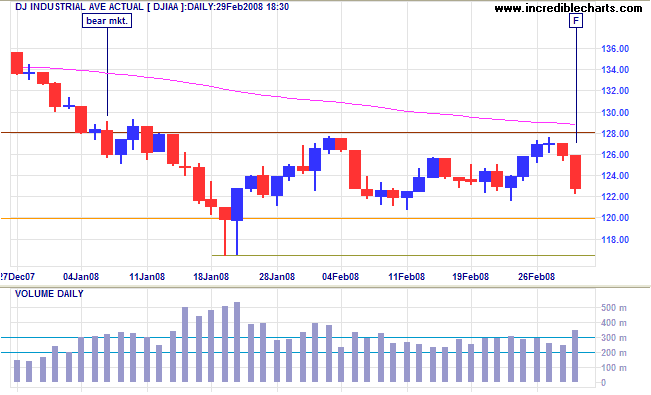
Short Term: The index is headed for a test of support at 12000. A close below 12000 would indicate the start of another (primary) downward leg, with short-term support at the January intra-day low of 11650.
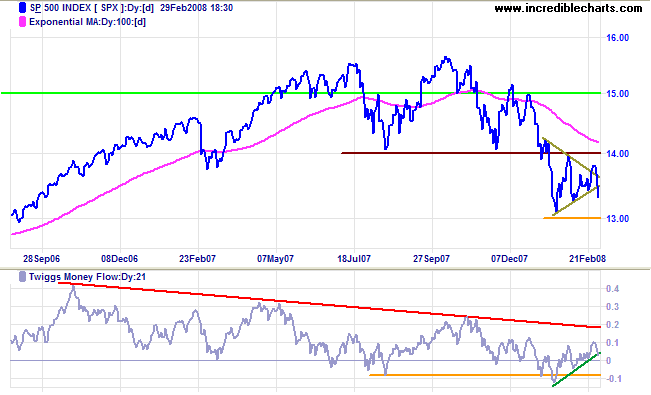
S&P 500
The S&P 500 shows a similar downward breakout. Penetration of 1300 would offer a (medium-term) target of 1300-(1400-1300)=1200.
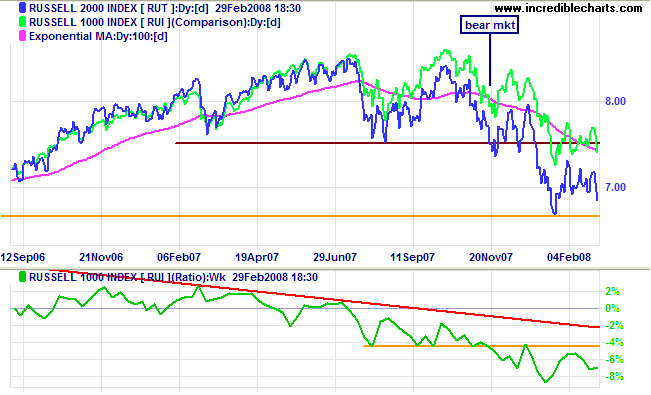
Small Caps
The Russell 2000 broke below 690 and is headed for a test of support at 650. Breakout below 650 would offer a target of 650-(750-650)=550. The falling ratio against the Russell 1000 signals migration to the relative safety of large cap stocks.
Technology
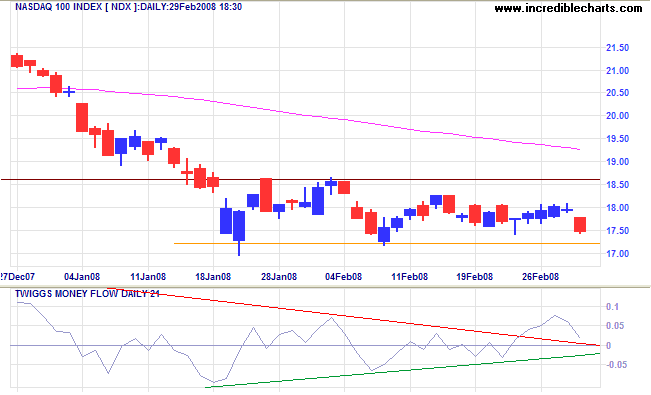
The Nasdaq 100 continues to consolidate between 1720 and 1860. Breakout below 1720 is likely and would signal another (primary) down-swing; while recovery above 1860 would indicate continuation of the market top. Twiggs Money Flow shows some short-term accumulation, with the rising green trendline, but continued whip-sawing around zero weakens the signal.
Transport
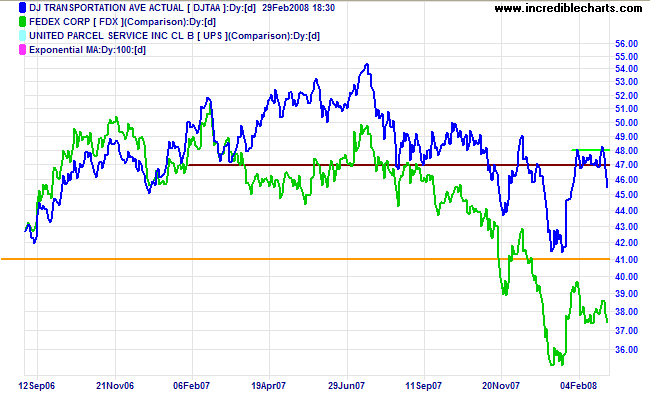
The Dow Jones Transportation Average broke down from its narrow consolidation and is headed for another test of 4100.
United Kingdom: FTSE
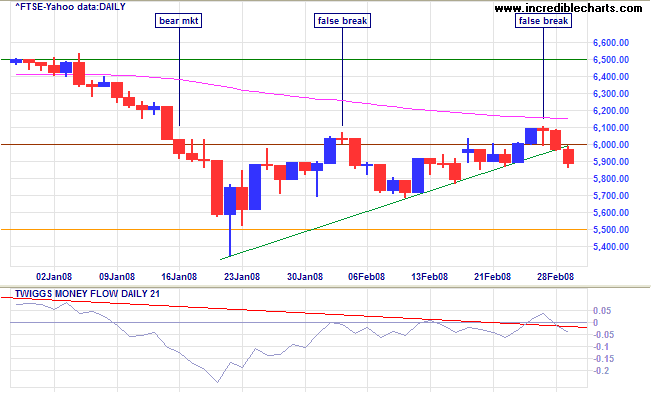
The FTSE 100 made another failed break above 6000 before heading for a test of support at 5500. Failure of support would offer a (medium-term) target of 5500-(6000-5500)=5000. Twiggs Money Flow reversed below zero, signaling short-term, as well as long-term, selling pressure.
India: Sensex
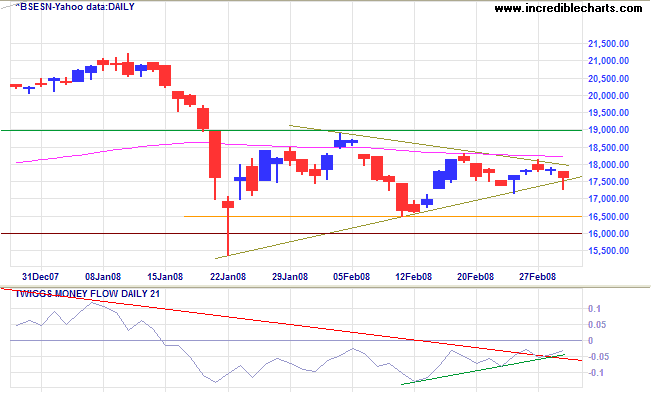
The Sensex reached the apex of its triangle — so little reliance can be placed on a breakout signal. A fall below 16500 remains more likely and offers a target of 16500-(19000-16500)=14000; while recovery above 19000 would signal a test of the previous high of 21000. The rising green trendline on Twiggs Money Flow signals short-term buying pressure, but the the signal is weak as the indicator remains below zero.
Japan: Nikkei
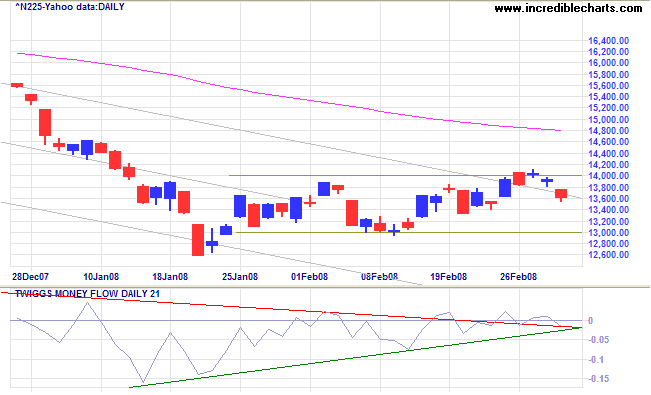
The Nikkei 225 made a failed breakout above 14000 and is now headed for a test of support at 13000. The primary down-trend is expected to continue, with a test of the original (2005) breakout level at 12000. The rising green trendline on Twiggs Money Flow indicates short-term buying pressure, but continued whipsaws around zero weaken the signal.
China: Hang Seng & Shanghai
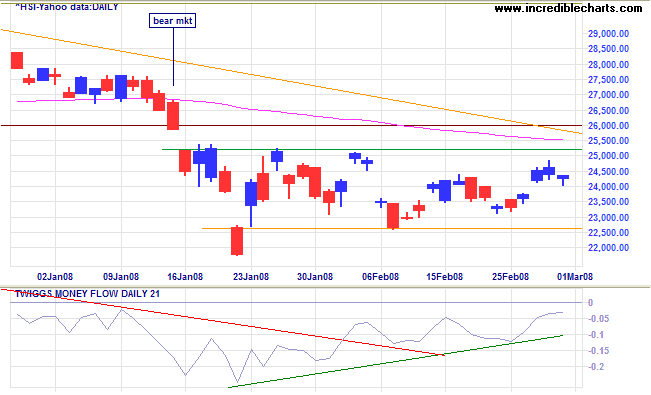
The Hang Seng is consolidating between 22600 and 25200. The primary down-trend is expected to continue — and breakout below the consolidation would offer a target of 20000 (from August 2007). Twiggs Money Flow shows a rising (green) trendline but remains below zero, weakening the (short-term) accumulation signal. Recovery above 25000/25200 remains unlikely — and would indicate that the (primary) down-trend is weakening.
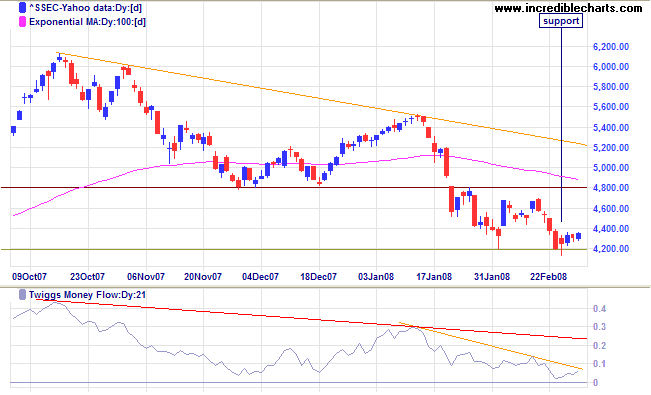
The Shanghai Composite found support at 4200. The primary down-trend is expected to continue and further narrow consolidation between 4200 and 4400 would be a bear signal. Downward breakout would offer a target of 3600 (from July 2007). Twiggs Money Flow indicates both short- and long-term selling pressure.
Australia: ASX
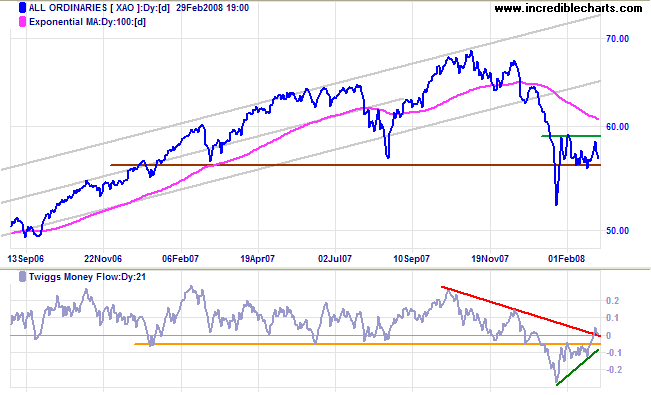
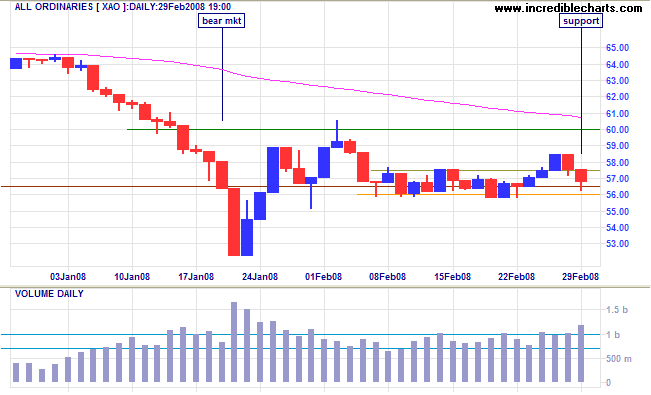
The All Ordinaries is in a primary down-trend and
remains susceptible to bearish influences from international
markets. Breakout below 5600 would offer a long-term target of
4800 (from June 2006).
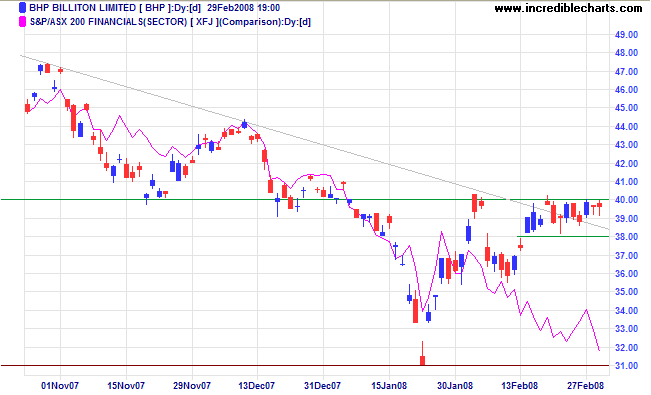
The Mining/Resources sector, however, acts as a counter-weight.
With strong (short-term) buying pressure signaled by
Twiggs Money Flow, breakout above 6000 is now as likely
— and would indicate a continuation of the broad market
top.
The opposing forces are best illustrated by the following chart. The narrow rectangle displayed by BHP (between 38.00 and 40.00) signals an upward breakout. Financials, however, are headed in the opposite direction.
Short Term: The All Ords made a failed break above 5750 but now shows long tails and strong volume — indicating support at 5600. Recovery above 5850 would signal a test of 6000. Breakout below 5600 remains as likely, because of the bearish influence of international markets, and would test support at 5200.
Always sell what shows you a loss and keep what shows you a
profit. That was so obviously the wise thing to do and so well
known to me that even now I marvel at myself for doing the
reverse.
~ Jesse Livermore in Edwin Lefevre's Reminiscences of a Stock Operator
To understand my approach, please read Technical Analysis & Predictions in About The Trading Diary.

Author: Colin Twiggs is a former investment banker with almost 40 years of experience in financial markets. He co-founded Incredible Charts and writes the popular Trading Diary and Patient Investor newsletters.
Using a top-down approach, Colin identifies key macro trends in the global economy before evaluating selected opportunities using a combination of fundamental and technical analysis.
Focusing on interest rates and financial market liquidity as primary drivers of the economic cycle, he warned of the 2008/2009 and 2020 bear markets well ahead of actual events.
He founded PVT Capital (AFSL No. 546090) in May 2023, which offers investment strategy and advice to wholesale clients.
