Bear Rally Fading
By Colin Twiggs
February 9, 2:30 a.m. ET (6:30 p.m. AET)
These extracts from my trading diary are for educational purposes and should not be interpreted as investment advice. Full terms and conditions can be found at Terms of Use.
USA
All 5 indexes below confirm that we are in a bear market. What is still unclear is whether this will be mild or severe.
Dow Jones Industrial Average
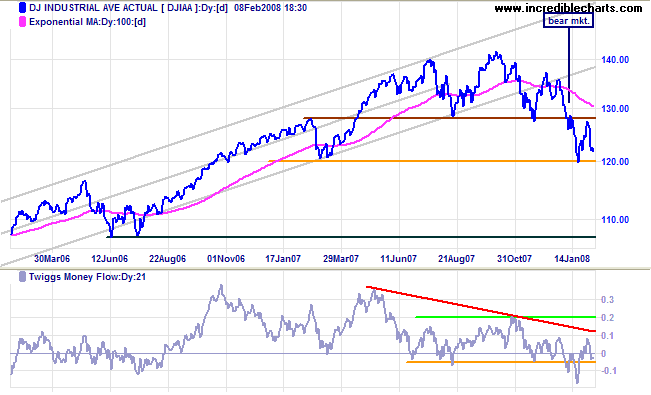
The Dow respected resistance at 12800 (the former primary support level) and is now headed for a test of support at 12000. Breakout below this level would offer a medium-term target of 11200 to 10700 (the June 2006 low): 12000-(12800-12000) = 11200.
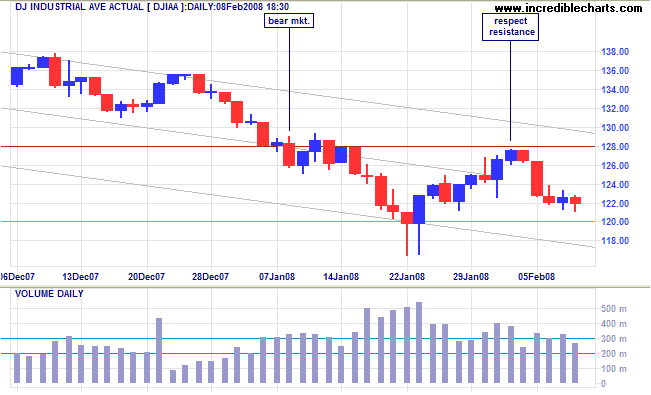
Short Term: Narrow ranges and large volumes indicate further support at 12000. A close below 12000 remains more likely and would signal the start of another (primary) down-swing; recovery above 12400 would warn of another test of 12800.
S&P 500
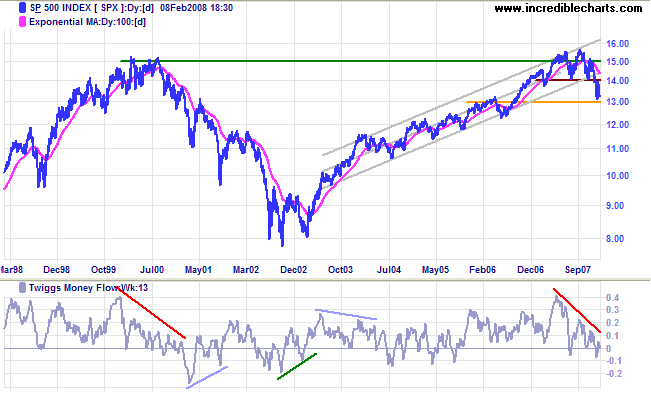
The S&P 500 is similarly testing support at 1300. Failure would offer a (medium-term) target of 1300-(1400-1300)=1200. Look for confirmation of the bear market from retracements (bear rallies) respecting the long-term (100-day) moving average.
Small Caps
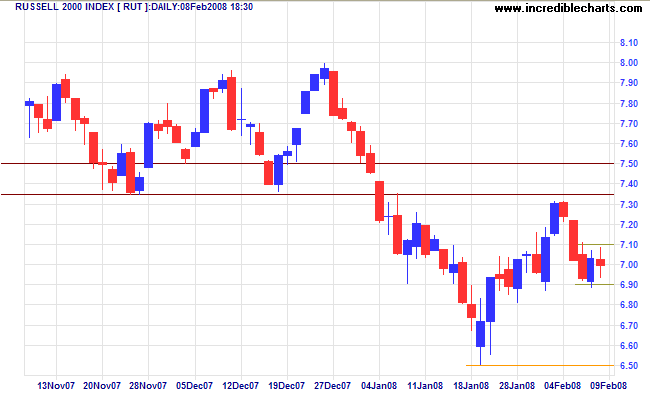
The Russell 2000 respected resistance at 735/750 and is now headed for support at 650. A fall below 690 would confirm this; recovery above 710, while not expected, would indicate another test of 735/750.
Technology
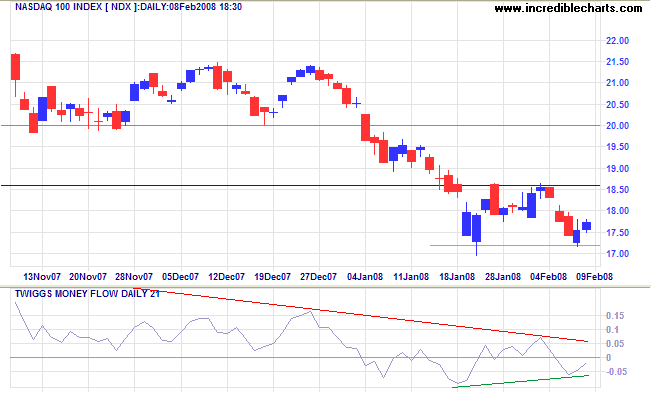
The Nasdaq 100 is consolidating between 1860 and 17200. Twiggs Money Flow signals short-term accumulation but long-term distribution. A fall below 1720 is more likely and would signal another (primary) down-swing, while recovery above 1860 would warn of a test of 2000 — and that the primary down-trend is weakening.
Transport
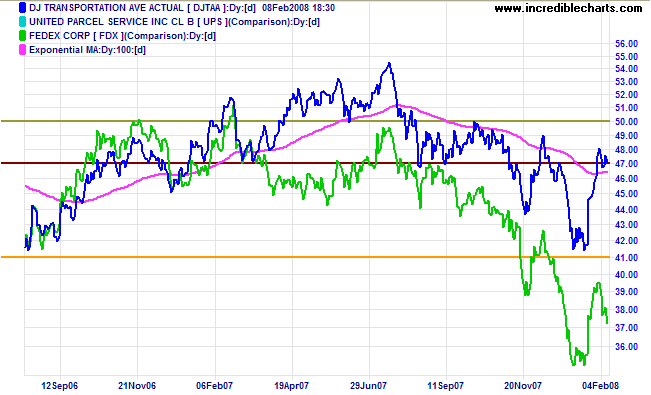
The Dow Jones Transportation Average remains in a primary down-trend. Fedex shows the likely direction, retracing to test support (at 4100 for the transport average).
United Kingdom: FTSE
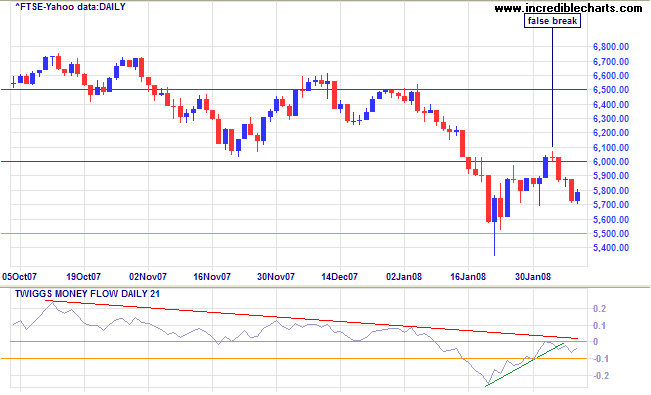
The FTSE 100 made a false break above the former primary support level of 6000, before reversing to test support at 5500. Twiggs Money Flow respected the zero line from below, confirming the primary down-trend. Failure of support (at 5500) would offer a (short/medium-term) target of 5500-(6000-5500)=5000.
India: Sensex
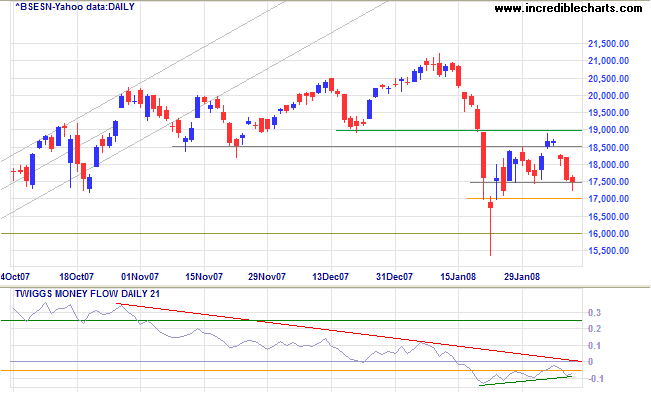
The Sensex broke through resistance at 18500, but encountered stronger opposition at 19000, causing the index to retreat, until a long tail on Friday indicated (short-term) support at 17500. Twiggs Money Flow signals long-term distribution but short-term accumulation. The consolidation is now loose and we should adjust our signals accordingly: breakout above 19000 would signal another test of 21000, while reversal below 17000 would warn of a test of 16000.
Japan: Nikkei
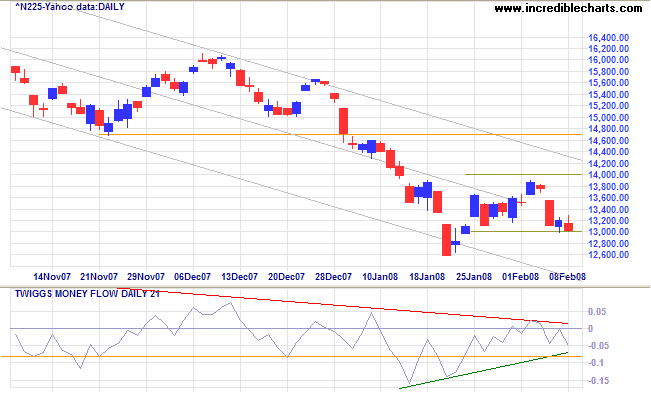
The Nikkei 225 is consolidating between 13000 and 14000. Breakout below 13000 would signal another (primary) down-swing, while recovery above 14000 would test resistance at 14700. Twiggs Money Flow signals long-term distribution but short-term accumulation.
China: Hang Seng & Shanghai
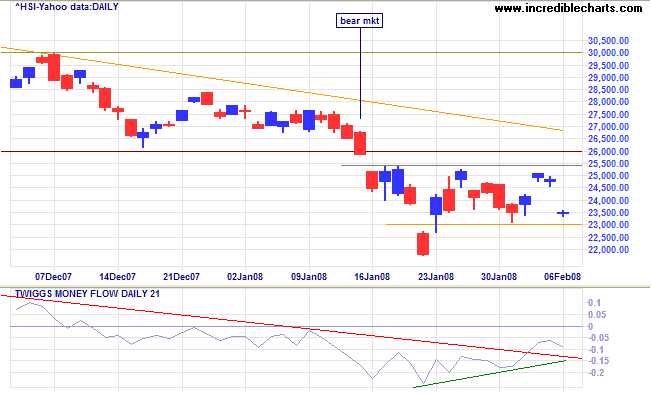
The Hang Seng is consolidating between 23000 and 25400. Twiggs Money Flow signals short-term accumulation but long-term distribution. Breakout below 23000 is more likely, and would warn of another (primary) down-swing with a target of 20000 (from August 2007). Recovery above 26000 is not expected — and would indicate that the primary down-trend is weakening.
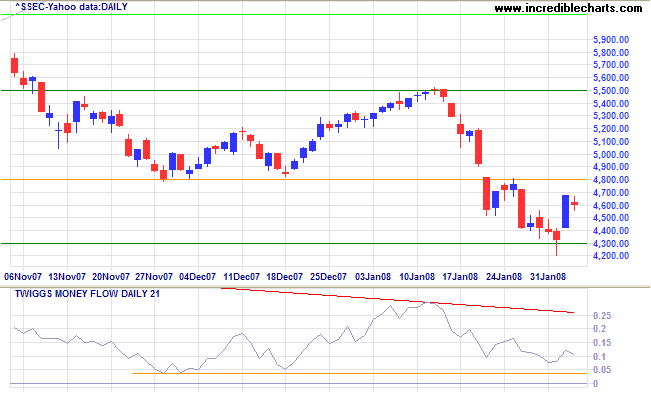
The Shanghai Composite retraced after finding support at 4300. Twiggs Money Flow signals long-term distribution and a fall below 0.04 would be a further bear signal. Reversal below 4300 is expected and would signal another primary down-swing, with a target of 3600 (from July 2007). Recovery above 4800 is less likely and would indicate that the (primary) down-trend is weakening.
Australia: ASX
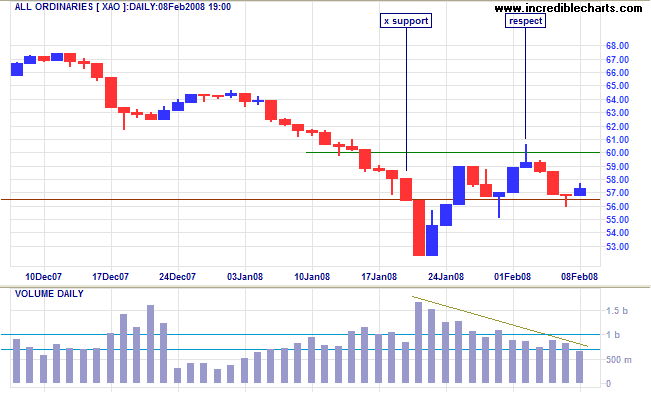
The All Ordinaries recovered to above the former primary support level at 5650, where it is consolidating in a narrow band. Twiggs Money Flow signals short-term accumulation but long-term distribution. Breakout above 6000 would signal continuation of the market top — rather than resumption of a bull market. Reversal below 5650 is equally likely, given the bearish influence of international markets, and would offer a long-term target of 4800 (from June 2006).
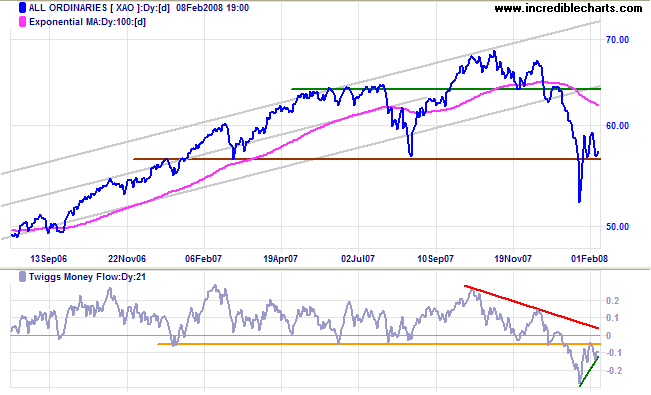
Short Term: Declining volume during the recent consolidation is a positive sign, but low volume and a narrow range on Friday indicate lack of enthusiasm from buyers and another test of support at 5600/5650. Reversal below 5650 would offer a short-term target of 5200 (the January low), while breakout above 6000 would be likely to find resistance around 6250/6450.
Don't take action with a trade until the market itself confirms
your opinion. Being a little late in a trade is insurance that
your opinion is correct. In other words, don't be an impatient
trader......
Remember this: When you are doing nothing, those speculators
who feel they must trade day in and day out, are laying the
foundation for your next venture. You will reap benefits from
their mistakes.
~ Jesse Livermore in Edwin Lefevre's Reminiscences of a Stock Operator
To understand my approach, please read Technical Analysis & Predictions in About The Trading Diary.

Author: Colin Twiggs is a former investment banker with almost 40 years of experience in financial markets. He co-founded Incredible Charts and writes the popular Trading Diary and Patient Investor newsletters.
Using a top-down approach, Colin identifies key macro trends in the global economy before evaluating selected opportunities using a combination of fundamental and technical analysis.
Focusing on interest rates and financial market liquidity as primary drivers of the economic cycle, he warned of the 2008/2009 and 2020 bear markets well ahead of actual events.
He founded PVT Capital (AFSL No. 546090) in May 2023, which offers investment strategy and advice to wholesale clients.
