
We wish all our readers peace and goodwill over the Christmas
season
and prosperity in the year ahead.
In A Cleft Stick
By Colin Twiggs
December 15, 2:00 a.m. ET (6:00 p.m. AET)
This will be my last newsletter for the year. Unless something unusual happens in the market, I will be taking a break until mid-January. These extracts from my trading diary are for educational purposes and should not be interpreted as investment advice. Full terms and conditions can be found at Terms of Use.
USA
The Fed is now fighting a war on two fronts, limiting its ability to manouevre. On the one hand, we have the liquidity crisis in financial markets. Citigroup's decision to take $49 billion of SIV assets back onto its balance sheet may help to restore confidence (Bloomberg), but the banking sector faces further losses in 2008 — before the housing market recovers.
On the other hand, we have the specter of inflation, with the consumer price index rising 0.8% in November and core CPI up 0.3% (Marketwatch), while producer prices (finished goods) spiked 3.2% (BLS news release).
The prospect of further rate cuts fades as the Fed has to make some hard choices. Restoring confidence in the banking sector will remain priority #1, but taming inflation is likely to take precedence over bouyant stock prices and consumption.
Dow Jones Industrial Average
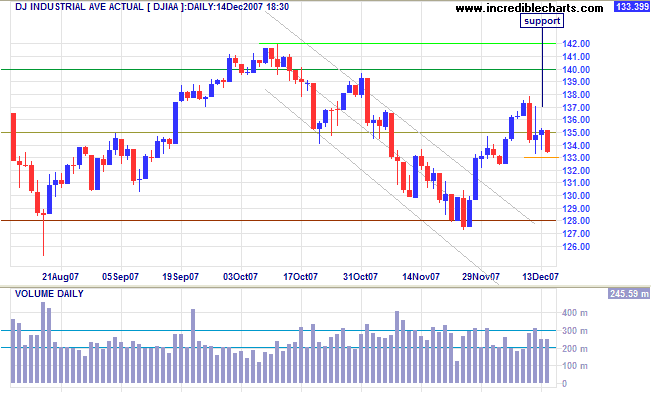
The Dow is in a market top, with failed upward/downward breakouts accompanied by heavy volume. Twiggs Money Flow continues to display a large bearish divergence, signaling long-term distribution; a fall below -0.05 would warn of a (primary) reversal.
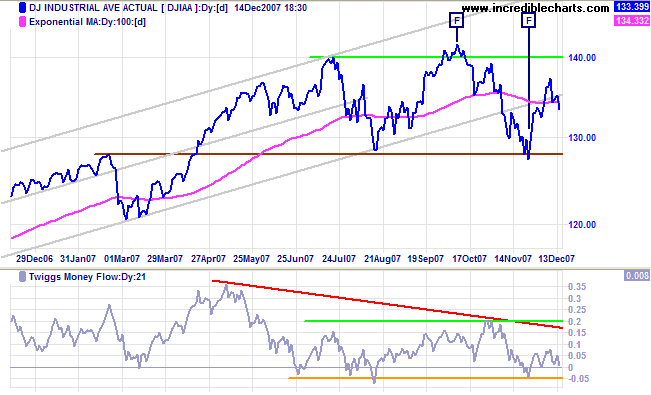
Short Term: Probability of a bear market remains about 2 to 1, but would increase if Monday breaks through short-term support at 13300, warning of another test of primary support at 12800. Recovery above 13800, while not expected, would signal a test of resistance at 14200.
S&P 500
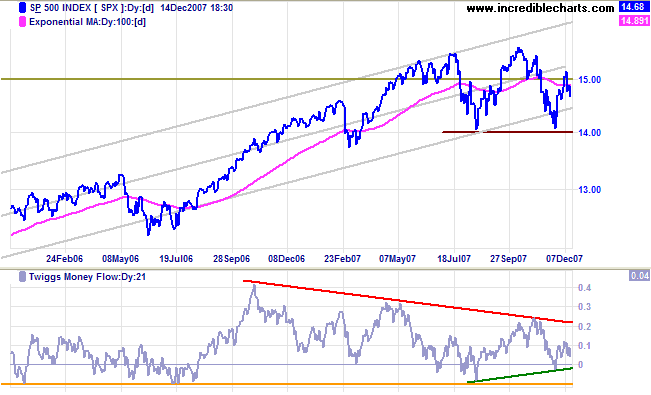
The S&P 500 displays a similar top to the Dow. The failed breakout above resistance at 1500 is a bearish sign, warning of another test of primary support at 1400. Twiggs Money Flow displays a large triangle and breakout would indicate future direction.
Small Caps
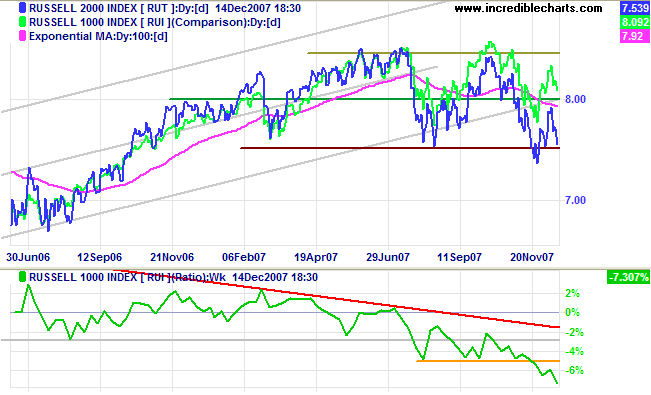
The Russell 2000 is falling faster than large cap indexes. A close below 750 would confirm the primary down-trend. The falling price ratio (to the large cap Russell 1000) shows investors favoring the relative safety of large cap stocks.
Transport
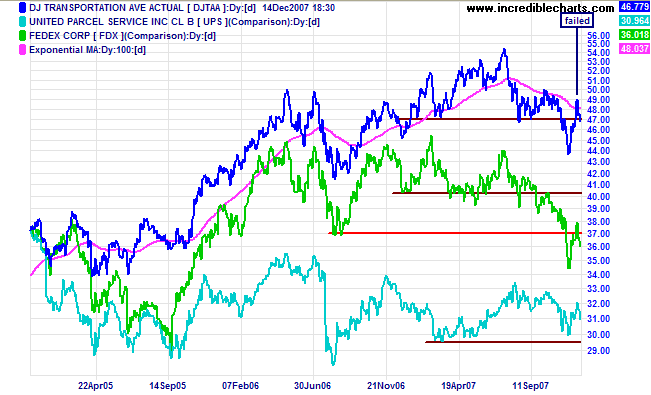
The Dow Jones Transportation Average is in a (primary) down-trend. Attempted recovery above 4700 failed, with Fedex (often a lead indicator for the broader economy) dragging the index lower. UPS (another indicator of broad economic activity) is also edging lower, but remains above primary support.
United Kingdom: FTSE
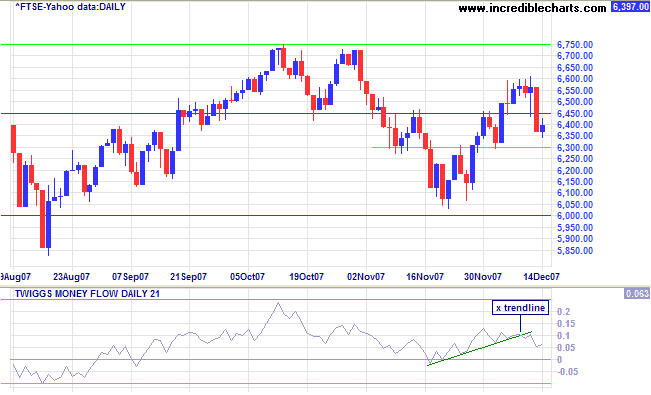
The FTSE 100 displays a market top similar to the Dow and S&P 500. The index is testing short-term support at 6300; failure would threaten primary support at 6000, while recovery above 6600 would test (primary) resistance at 6700 to 7000. Twiggs Money Flow signals short-term distribution and a fall below zero would warn of a bear market.
India: Sensex
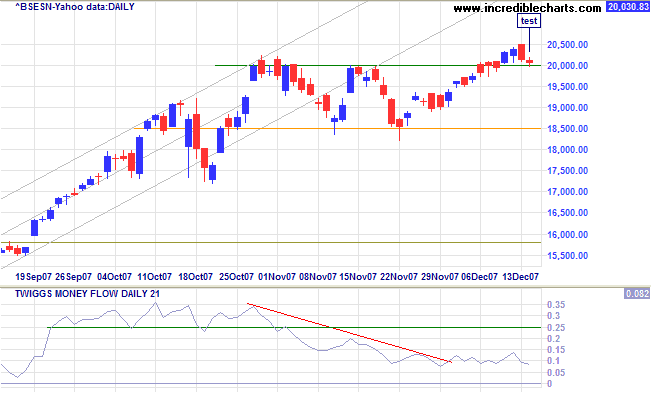
The Sensex broke through resistance at 20000 before retracing to test the new support level. Respect would signal a new (primary) advance, while failure would most likely test support at 18500. Normally failure would be a relatively low probability, but bearish signs on other major indexes even up the odds. A large bearish divergence on Twiggs Money Flow also warns of distribution.
Japan: Nikkei
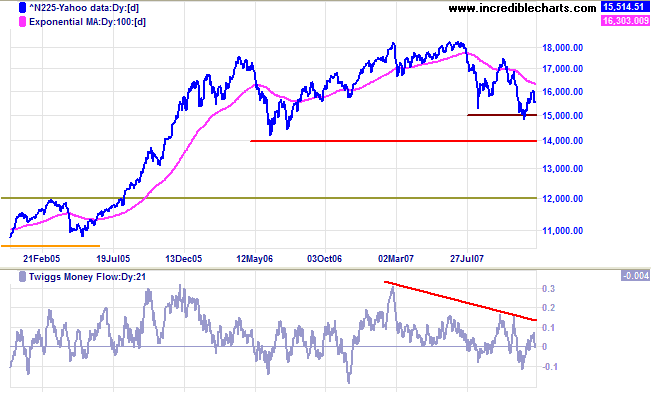
The Nikkei 225 is in a primary down-trend and Twiggs Money Flow shows no signs of recovery. Reversal below 15000 would signal another decline, with a target of 14000.
China: Hang Seng & Shanghai
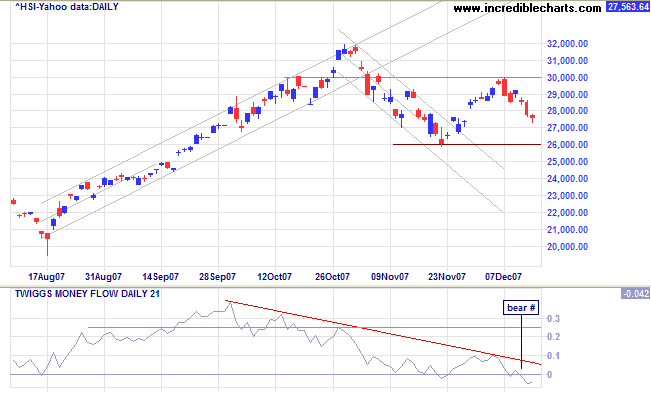
The Hang Seng is headed for a test of primary support at 26000; breakout would commence a primary down-trend. Twiggs Money Flow displays a large bearish divergence — and breakout below its August (primary) low of zero warns of a bear market. Recovery above 30000, while not expected, would indicate another primary advance.
The Shanghai Composite continues a secondary correction. Friday's short-term reversal indicates another test of the upper trend channel is likely. However, penetration of the low of 4850 would warn of a swing to the lower channel border. Twiggs Money Flow signals short-term accumulation.
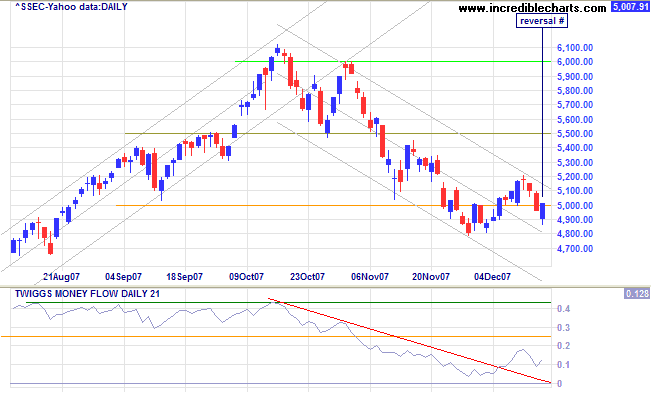
The bull market is in stage 3 (the final phase), with a price earnings ratio above 30.
Australia: ASX
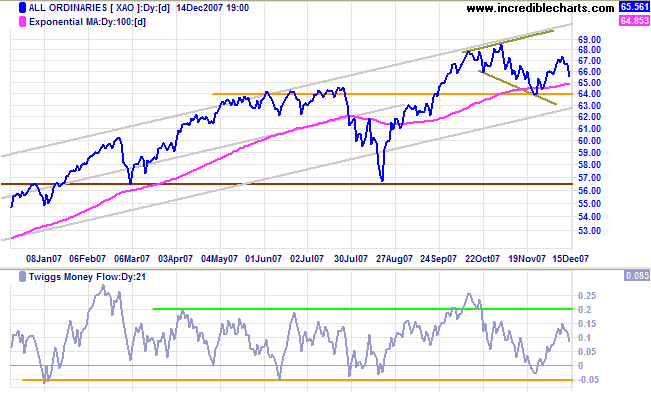
The All Ordinaries is in a broadening top pattern, drifting towards the lower trend channel. Breakout below the trend channel would warn that the (primary) up-trend is losing momentum. Twiggs Money Flow reversal below -0.05 would warn of a bear market, while recovery above 0.2 would be bullish.
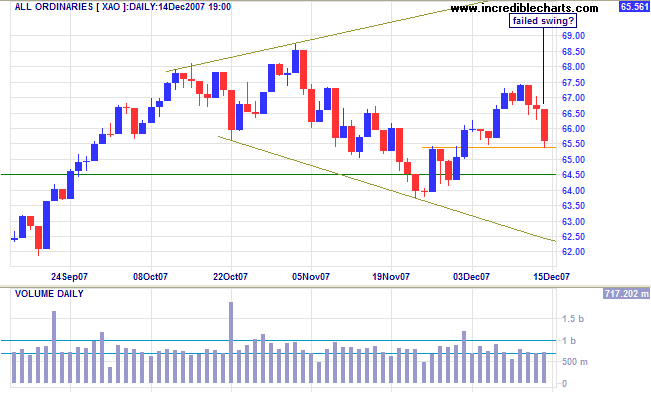
Short Term: The index is testing short-term support at 6550. Failure would warn of a downward breakout from the broadening top formation, with a target of primary support at 5650. Recovery above 6750, on the other hand, would indicate a test of the upper channel border.
If I were walking along a railway track and saw an express
train coming at me at sixty miles an hour, I would be a damned
fool not to get off the track and let the train go by. After it
had passed, I could always get back on the track again, if I
desired.
~ Jesse Livermore:
How To Trade In Stocks (1940).
To understand my approach, please read Technical Analysis & Predictions in About The Trading Diary.

Author: Colin Twiggs is a former investment banker with almost 40 years of experience in financial markets. He co-founded Incredible Charts and writes the popular Trading Diary and Patient Investor newsletters.
Using a top-down approach, Colin identifies key macro trends in the global economy before evaluating selected opportunities using a combination of fundamental and technical analysis.
Focusing on interest rates and financial market liquidity as primary drivers of the economic cycle, he warned of the 2008/2009 and 2020 bear markets well ahead of actual events.
He founded PVT Capital (AFSL No. 546090) in May 2023, which offers investment strategy and advice to wholesale clients.
