False Breaks Warn Of A Market Top
By Colin Twiggs
December 8, 2:00 a.m. ET (6:00 p.m. AET)
These extracts from my trading diary are for educational purposes and should not be interpreted as investment advice. Full terms and conditions can be found at Terms of Use.
USA
Dow Jones Industrial Average
The Dow Jones Industrial Average is rallying in anticipation of a rate cut at next weeks FOMC meeting. It is doubtful whether providing banks with cheap money will encourage them to resume lending in a market with falling asset prices, but it may improve their ability to carry non-performing assets rather than being forced to sell at fire-sale prices.
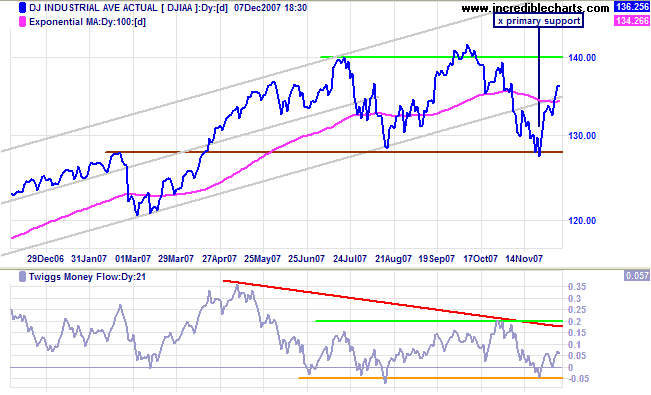
Probability of a bear market remains high: at least 2 to 1. Current activity resembles a market top, with failed upward/downward breakouts accompanied by heavy volume. Twiggs Money Flow continues to display a large bearish divergence, signaling long-term distribution.
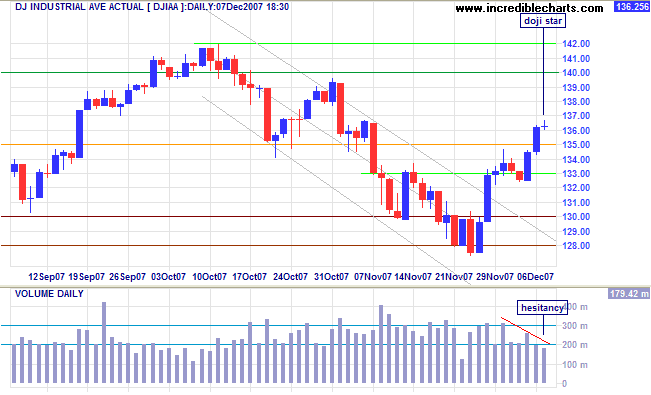
Short Term: Declining volume and a doji star candlestick pattern indicate that the rally is losing momentum. Reversal below 13500 would warn of another test of primary support at 12800, while respect of 12800 would signal a test of resistance at 14200.
Transport
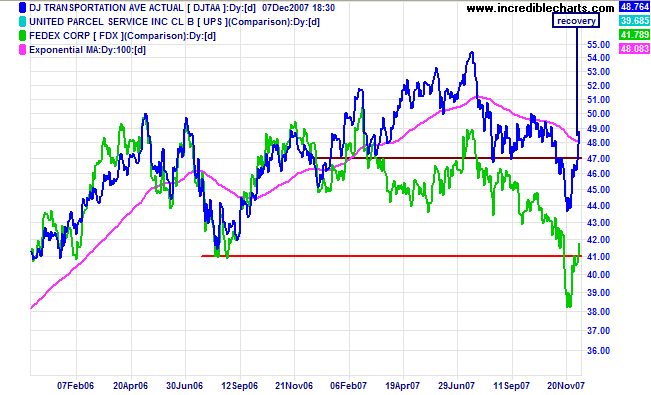
The Dow Jones Transportation Average and Fedex (often a lead indicator for the broader economy) also rallied in anticipation of an increase in consumption, fuelled by further rate cuts from the Fed. The primary trend, however, remains down.
Small Caps & Technology
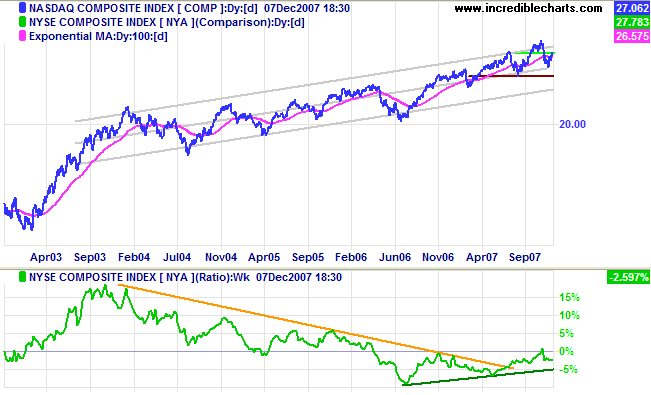
The Nasdaq Composite hesitated after breaking resistance at 2700. A test of the upper trend channel is likely, but reversal below 2700 would warn of a test of primary support at 2450.
The rising price ratio against the NYSE Composite indicates that tech stocks continue to out-perform the broader market.
S&P 500
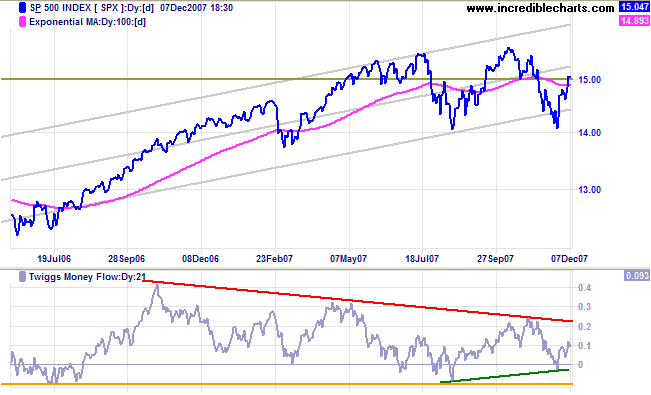
The S&P 500 likewise hesitated after penetrating resistance at 1500. Reversal below 1500 would warn of another test of primary support at 1400, while respect of the new support level would signal a test of 1550. Breakout from the large triangle on Twiggs Money Flow would indicate long-term direction.
United Kingdom: FTSE
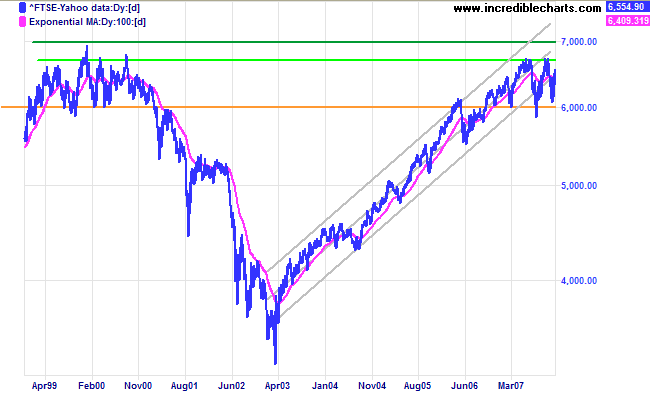
The FTSE 100 displays a topping pattern similar to eight years ago (1999). Expect failed breakouts to give false signals, until a retracement respects support/resistance from the breakout point (as in early 2001). Primary support remains at 6000, with resistance at 6700.
India: Sensex
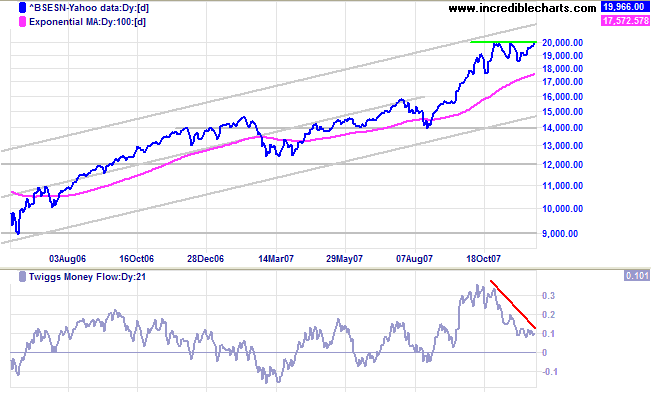
The Sensex is consolidating below resistance at 20000. Breakout would signal a further advance, while reversal below 18500 would warn of a swing to the lower trend channel. Narrow consolidation is a bullish sign, but the large bearish divergence on Twiggs Money Flow tends to negate this.
Japan: Nikkei
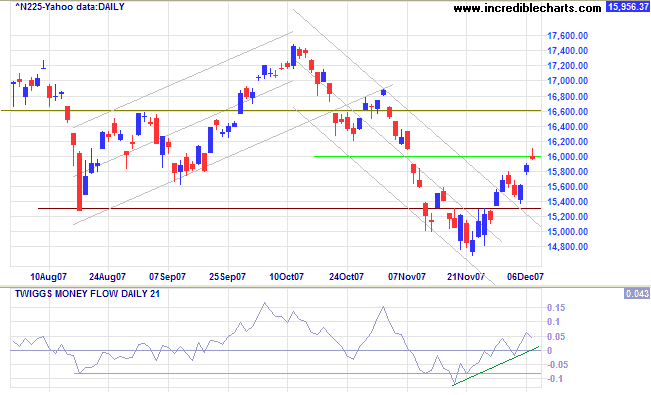
The Nikkei 225 is in a slow primary down-trend, lacking much direction. Twiggs Money Flow signals short-term accumulation. A (large) trough that finishes higher than primary support at 14700 would warn of a (primary) reversal.
China: Hang Seng & Shanghai
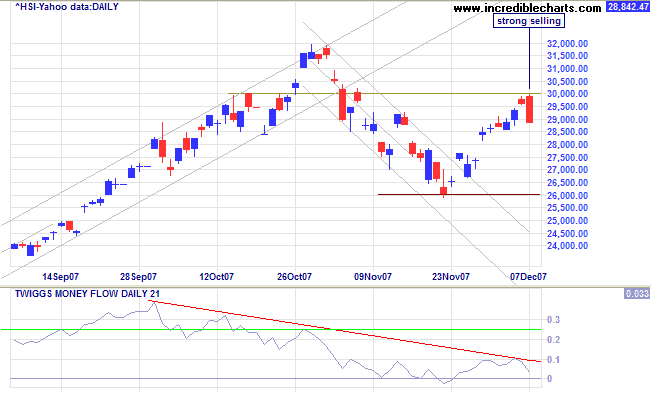
The Hang Seng encountered strong resistance at 30000. Reversal below support at 26000 would signal a primary down-trend; breakout above 30000, while less likely at present, would be a bullish sign favoring another primary advance. Twiggs Money Flow displays a large bearish divergence, warning of long-term distribution.
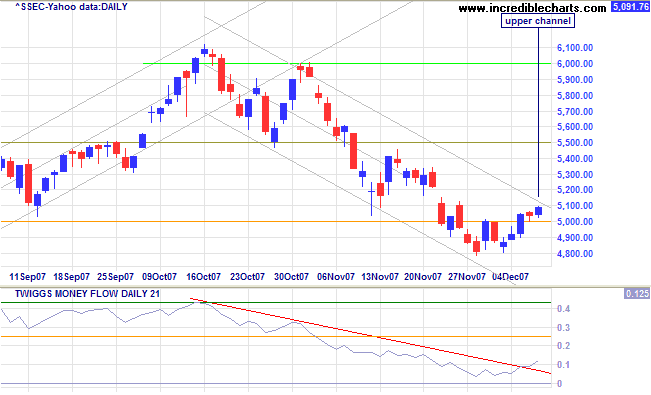
The Shanghai Composite continues in a secondary correction, testing the upper border of the trend channel. Reversal below 5000 would indicate a swing to the lower channel border, while breakout above the trend channel would warn that the correction is ending. Twiggs Money Flow penetration of the falling trendline signals short-term accumulation.
The market is in stage 3 (the final phase) of a bull market: current growth figures are reflected in a price earnings ratio above 30, but may well prove unsustainable in the long-term.
Australia: ASX
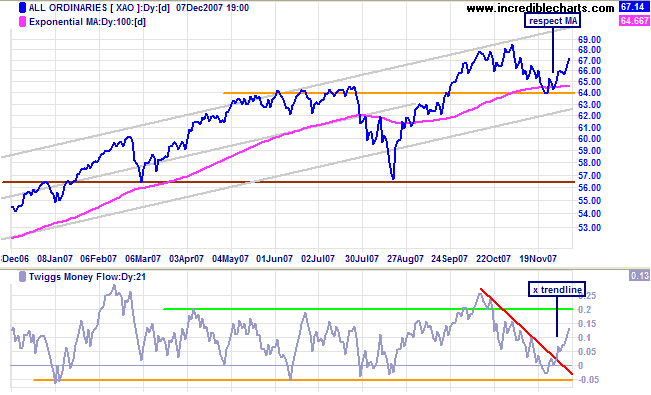
The All Ordinaries is headed for a test of resistance at
6800 — and the upper trend channel.
Twiggs Money Flow signals medium-term accumulation.
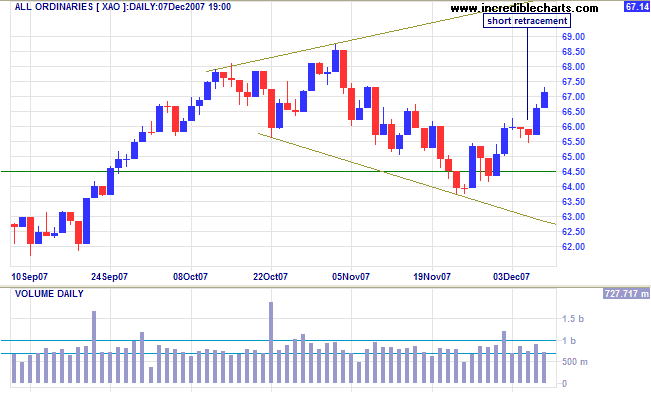
Short Term: Tht index is headed for a test of the upper border of the broadening top formation; a failed swing (that does not reach the opposite border) would warn of a downward breakout. Wednesday's short retracement is a bullish sign.
I knew what to do..... Tape reading was an important part of
the game; so was beginning at the right time; so was sticking
to your position. But my greatest discovery was that a man must
study general conditions, to size them so as to anticipate
probabilities.
~ Jesse Livermore in Edwin Lefevre's Reminiscences of a Stock Operator (1923).
To understand my approach, please read Technical Analysis & Predictions in About The Trading Diary.

Author: Colin Twiggs is a former investment banker with almost 40 years of experience in financial markets. He co-founded Incredible Charts and writes the popular Trading Diary and Patient Investor newsletters.
Using a top-down approach, Colin identifies key macro trends in the global economy before evaluating selected opportunities using a combination of fundamental and technical analysis.
Focusing on interest rates and financial market liquidity as primary drivers of the economic cycle, he warned of the 2008/2009 and 2020 bear markets well ahead of actual events.
He founded PVT Capital (AFSL No. 546090) in May 2023, which offers investment strategy and advice to wholesale clients.
