Bear Market Risk
By Colin Twiggs
December 1, 3:30 a.m. ET (7:30 p.m. AET)
These extracts from my trading diary are for educational purposes and should not be interpreted as investment advice. Full terms and conditions can be found at Terms of Use.
USA
Dow Jones Industrial Average
The Dow Jones Industrial Average signaled a bear market, according to classic Dow Theory, when it penetrated primary support at 12800. Fundamental supporting evidence includes:
- A negative yield curve in 2006/2007
- The Fed cutting the fed funds rate
- The widening spread between T-Bill yields and rates in the $2 trillion commercial paper market
- Projections that the housing collapse will last well into 2008
- The Dow is below its long-term trend channel, indicating a loss of momentum
- Twiggs Money Flow continues to display a large bearish divergence, warning of a reversal
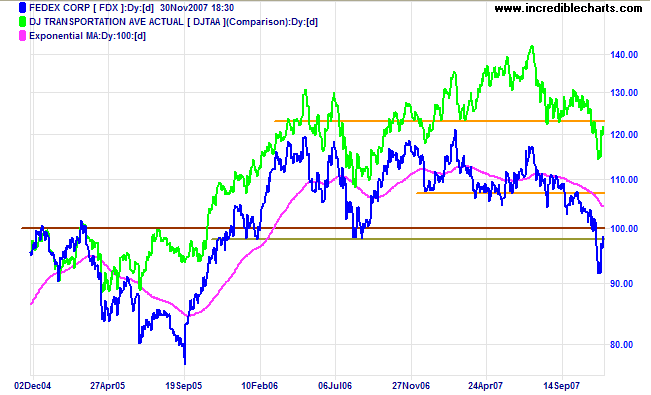
- Fedex, often a lead indicator for the economy, broke through long-term support at $100
- Dow Jones Transport index is in a primary down-trend
- A sharp reversal above 12800
- Reasonable third quarter earnings — outside of the financial and housing sectors
- A reasonable price earnings ratio of 18, indicating that the bull market has not reached stage 3.
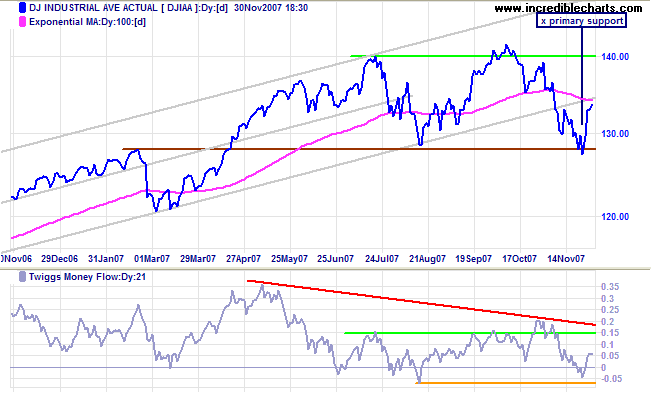
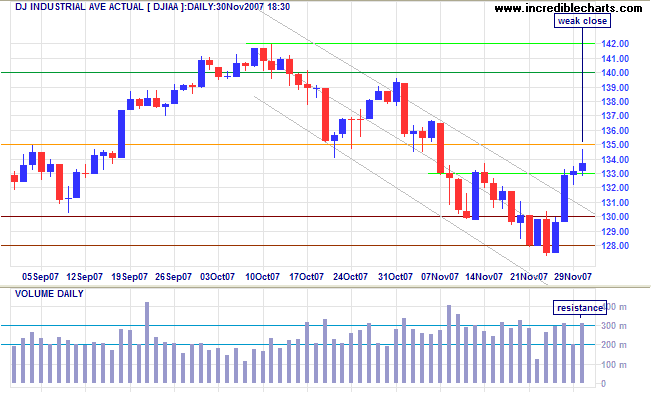
Short Term: The sharp rally of the last few days ended with a weak close and large volume on Friday, warning of resistance. Reversal below 12800 would confirm the bear market, while a higher trough (respecting 12800) would indicate a rally to test resistance at 14000.
Transport
The Dow Jones Transportation Average and Fedex (often a lead indicator for the broader economy) are both in primary down-trends and retracing to test resistance at their former support levels. Respect of resistance would confirm the down-trend.
Small Caps & Technology
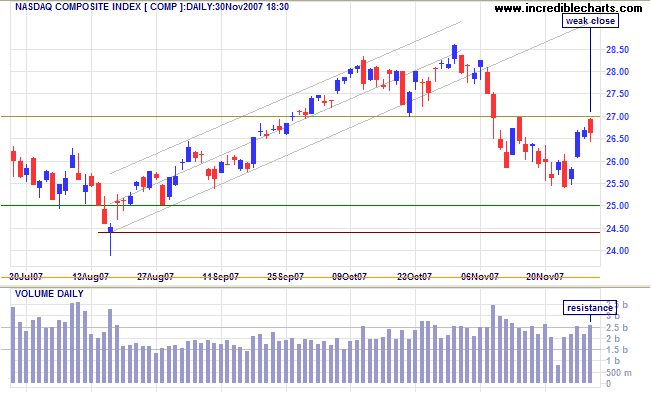
The Nasdaq Composite is testing resistance at 2700. Friday's large volume and red candle indicate strong selling. Respect of 2700 would warn of a test of primary support at 2450.
S&P 500
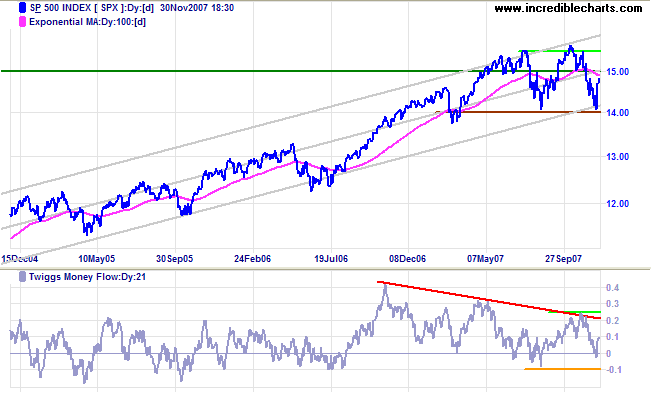
The S&P 500 respected primary support at 1400 and is headed for a test of the important 1500 resistance level. A rise above 1550 would signal another primary advance, while reversal below 1400 would indicate a primary down trend — and confirm the bear market. Twiggs Money Flow displays a large bearish divergence, favoring a reversal.
United Kingdom: FTSE
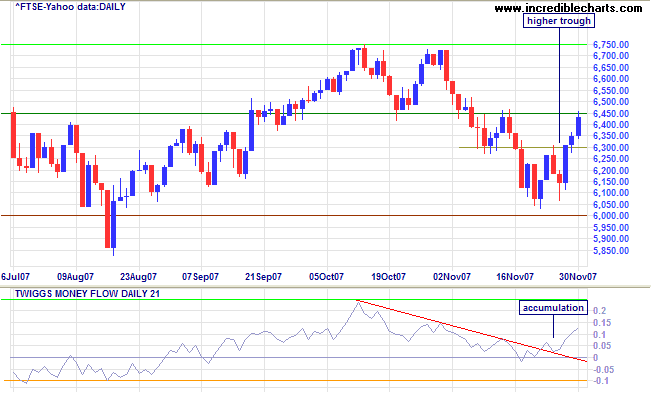
The FTSE 100 displays a higher trough and rising (short-term) Twiggs Money Flow, both bullish signs. Breakout above 6450 would confirm that threat of a primary down-trend is diminishing, while a rise above 6750 would signal another primary advance. Until there is a rise above 6450, however, reversal below 6000 remains a threat — and would signal a primary down-trend.
India: Sensex
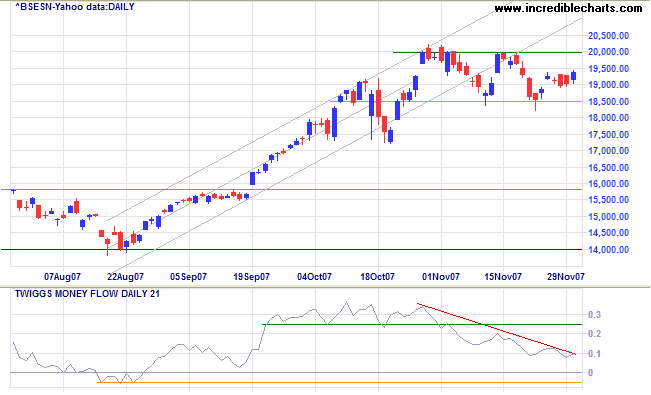
The Sensex is consolidating between 18500 and 20000: breakout will indicate future direction. Twiggs Money Flow recovery above 0.25 would be a bullish sign, while a fall below -0.05 would warn of a secondary correction.
Japan: Nikkei
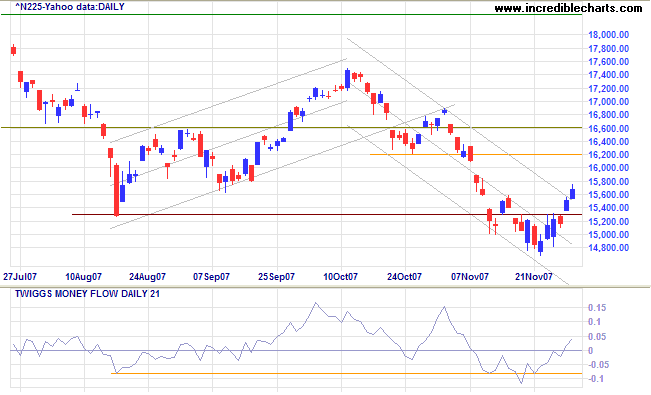
The Nikkei 225 completed a marginal break below primary support at 15300, indicating that the down-trend may be weakening. Twiggs Money Flow signals short-term accumulation. A retracement that respects support at 15300 would be a bullish sign.
China: Hang Seng & Shanghai
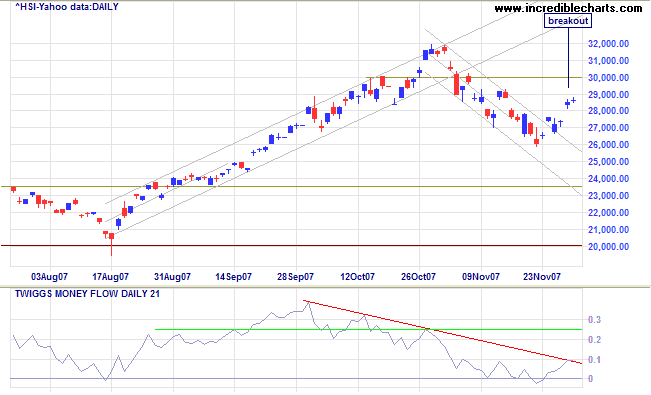
The Hang Seng broke out above its downward trend channel, indicating that the (secondary) correction has lost momentum. A higher trough on the next retracement, above support at 26000, would confirm the start of another (primary) advance. Twiggs Money Flow rising above 0.25 would be a bullish sign, while reversal below zero, though not expected, would be a strong bear signal.
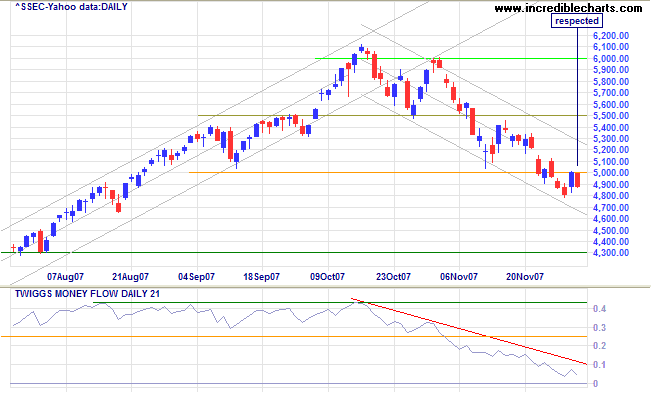
The Shanghai Composite retraced to test resistance at 5000, but Friday's red candle warns of further weakness. Twiggs Money Flow below its July low (0.25) signals strong selling. The market is in stage 3 (the final phase) of a bull market: current growth figures are reflected in a price earnings ratio above 30, but may well prove unsustainable in the long-term.
Australia: ASX
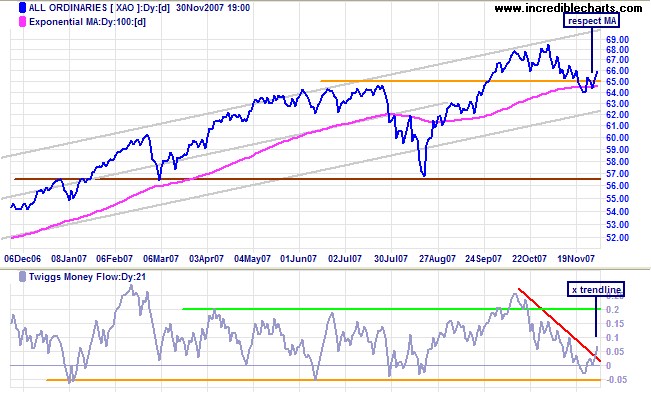
The All Ordinaries respected the long-term moving average and is headed for a test of resistance at 6800. Twiggs Money Flow rose above its downward trendline and signals short-term accumulation. Reversal below -0.05, while not expected, however, would be a strong bear signal.
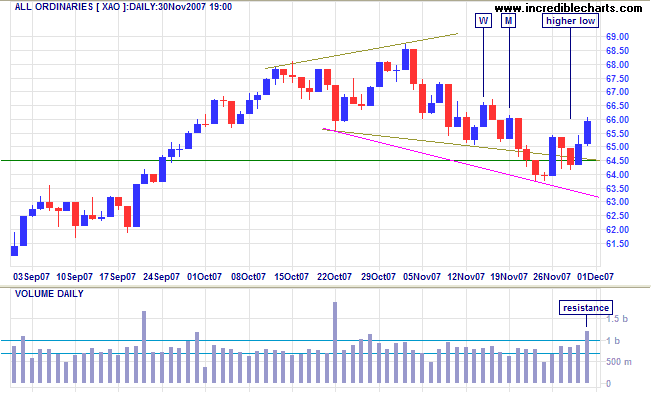
Short Term: I was premature in drawing the bottom border of the broadening top formation: with hindsight I should have waited for a rise above [W] rather than just a close [M] above the previous day's range. We now have a clear up-swing after Friday completed a trough with a rise above 6540. A swing that reverses before the upper border, however, would be a bearish sign. Large volume on Friday shows unusually high selling, but a follow-through (with further gains on Monday) would confirm that resistance has been overcome.
If stupidity got us into this mess, then why can't it get us
out?
~ Will Rogers (1879 - 1935)
To understand my approach, please read Technical Analysis & Predictions in About The Trading Diary.

Author: Colin Twiggs is a former investment banker with almost 40 years of experience in financial markets. He co-founded Incredible Charts and writes the popular Trading Diary and Patient Investor newsletters.
Using a top-down approach, Colin identifies key macro trends in the global economy before evaluating selected opportunities using a combination of fundamental and technical analysis.
Focusing on interest rates and financial market liquidity as primary drivers of the economic cycle, he warned of the 2008/2009 and 2020 bear markets well ahead of actual events.
He founded PVT Capital (AFSL No. 546090) in May 2023, which offers investment strategy and advice to wholesale clients.
