Strong Risk Of A Crash
By Colin Twiggs
November 24, 12:30 a.m. ET (4:30 p.m. AET)
These extracts from my trading diary are for educational purposes and should not be interpreted as investment advice. Full terms and conditions can be found at Terms of Use.
USA
The Yield Curve Revisited
Earlier in the week I published a recession warning based on behavior of the yield curve over the past 12 months. Every time there has been a significant rise in short-term interest rates over the last 45 years, and the yield differential (maroon line) falls to zero, a recession follows.
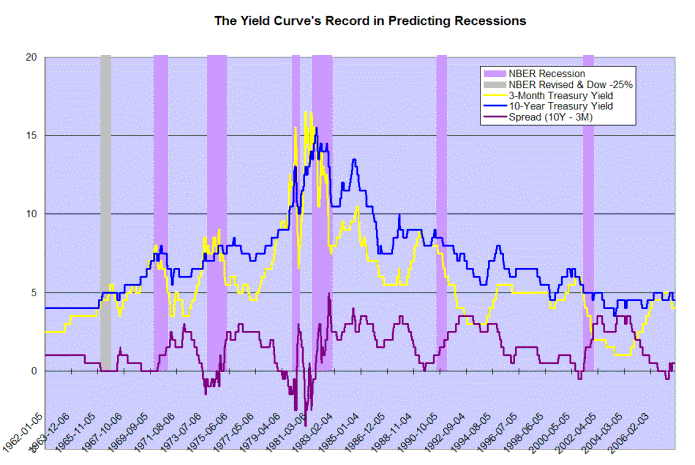
The flat or negative yield curve squeezes bank interest margins, causing a tightening of credit and a consequent slow-down of consumer spending and new investment — which drags the economy into a recession.
Some readers may doubt the ability of the yield curve to precipitate a recession and instead blame extraordinary events such as the Gulf War (1991) and collapse of the dotcom tech bubble (2001). In the interests of fostering a wider debate on the forum, I will attempt to briefly address these issues here.
- Wars create uncertainty and can push the economy into a recession if they are seen as a serious threat to the country, as in WW1 and WW2, but smaller conflicts have a more stimulatory effect due to increased defense spending. Edward Leamer, professor of economics at UCLA, points out that defense spending on the Korean War rescued the economy from recession in 1951 and the Vietnam War performed a similar service in 1967. These are the only two times since 1946 that a housing collapse has not led to a full-blown recession. There is similarly no evidence to suggest that the Gulf War caused the recession in 1991.
- The US economy has proved itself resilient to one-off shocks like the collapse of LTCM in 1998; 9/11 in 2001 (the 2001 recession started in March and ended November according to the NBER); the collapse of Enron in 2004; and Hurricane Katrina in 2005.
- Similarly, the slow-down in computer software and hardware investment after Y2K would not on its own have caused a recession in 2001.
To cause a recession, a localized shock (such as the dotcom crash) needs to find a vector to spread the contagion thoughout the economy; in much the same way that a virus outbreak may cause an epidemic. The banking system provides such a vector because of the leverage effect: a $1 reduction in reserves can cause a $10 reduction in bank lending (and consequently in spending).
The latest subprime debacle was caused by banks attempting to circumvent the margin squeeze. They accepted narrower margins and on-sold loans into off-balance sheet SIVs, to avoid the reserve requirements. Lending on narrow margins is and always will be bad banking practice, no matter what clever structures are developed to hide this from investors/regulators. What the banks actually achieved was to leverage the problem into a far greater threat. According to the OECD, the banking system currently faces losses of up to $300 billion due to subprime mortgage foreclosures. Taking leverage into account, that would translate in a $1 to $3 trillion reduction in bank credit — and spending.
An Irresistible Force
If we examine short-term rates, a self-reinforcing cycle [A > B > C] is evident since the 1980s, with each recession requiring more severe rate cuts by the Fed in order to stimulate the economy. Every artificial reduction in interest rates, however, merely compounds the problem, requiring even deeper rate cuts in the next cycle.
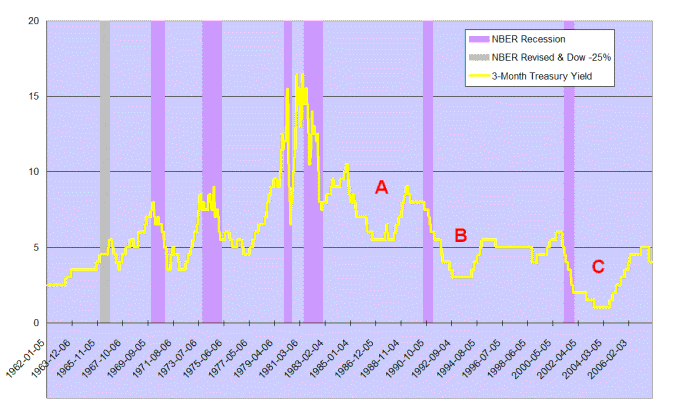
It would be a mistake to ascribe falling interest rates solely to a decline in inflation. Money supply is growing at a steady click and there is strong evidence to suggest that purchasing power of the dollar is declining at a much faster long-term rate than the official consumer price index.
The market is more powerful than any individual or organization, including the Federal Reserve, who may be able to effect a temporary shift from the market equilibrium, but opposing pressure will gradually build until it becomes an irresistible force. By attempting to defer the inevitable, the Fed is digging us into a deeper and deeper hole, with each wave bigger than the last.
If you find yourself in a hole, the first thing to do is stop
digging.
~ Will Rogers.
Dow Jones Industrial Average
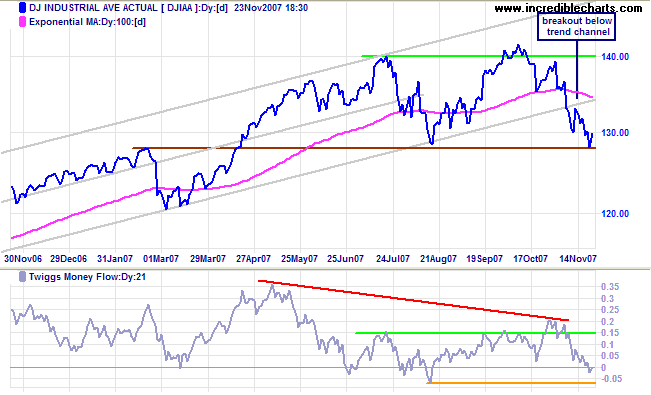
The Dow Jones Industrial Average made a clear break below its long-term trend channel, indicating a loss of momentum. Failure of support at 12800 would signal a primary trend reversal. Twiggs Money Flow shows a long-term bearish divergence (red) and a fall below -0.075 would warn that the primary trend is under threat.
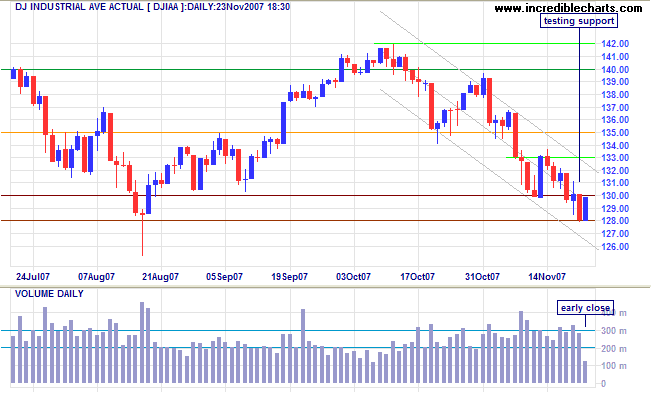
Short Term: Friday's volume was low due to the Thanksgiving long weekend and an early close on Friday. Expect some consolidation above primary support at 12800, but a downward breakout appears inevitable in the medium term, signaling reversal to a primary down-trend.
Transport
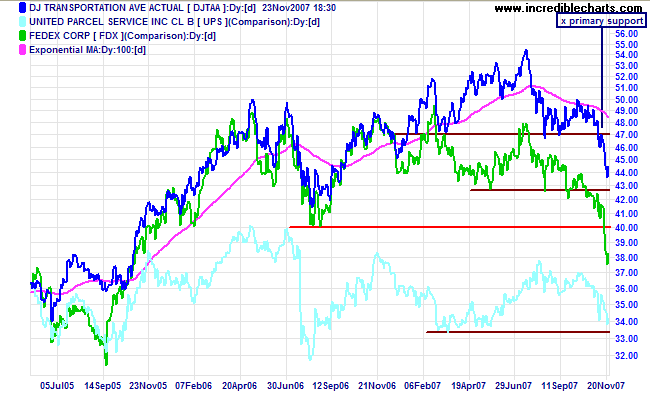
The Dow Jones Transportation Average and Fedex (often a lead indicator for the broader economy) have both started primary down-trends, indicating that the economy is slowing. UPS is headed for a test of primary support at its March 2007 low.
Small Caps & Technology
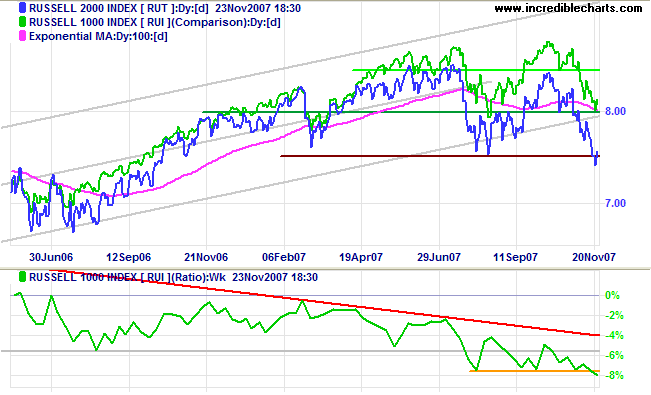
The Russell 2000 Small Caps index broke through support at 750, signaling the start of a primary down-trend. The declining price ratio (compared to Russell 1000) reflects the market shift towards the safety of large caps.
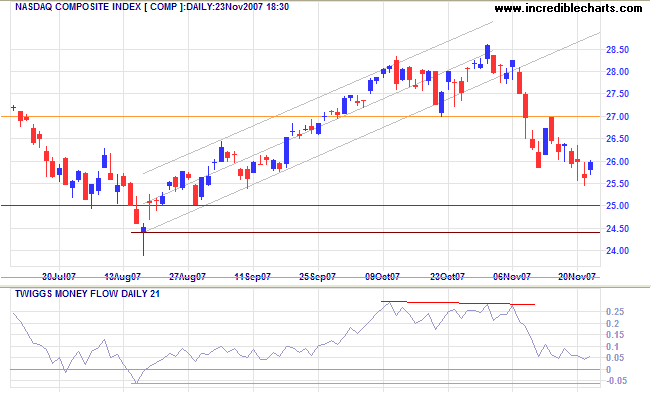
The Nasdaq Composite is headed for a test of primary support at 2450. A Twiggs Money Flow fall below -0.06 would warn that the primary trend is under threat.
S&P 500
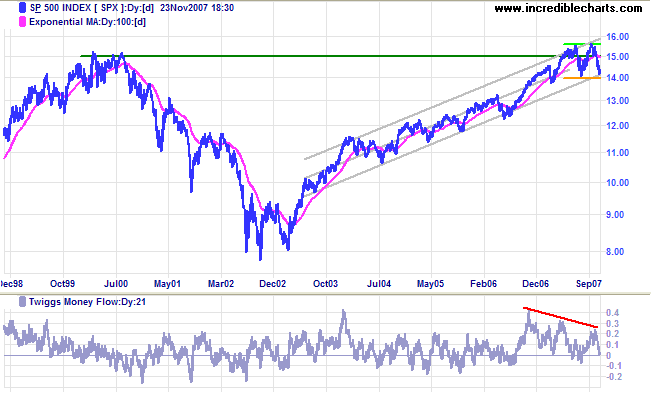
The S&P 500 is headed for a test of primary support at 1400. Failure would signal the start of a primary down-trend. Twiggs Money Flow displays a large bearish divergence, warning of a reversal. Recovery above 1500 is not expected, and would indicate that the threat is over.
United Kingdom: FTSE
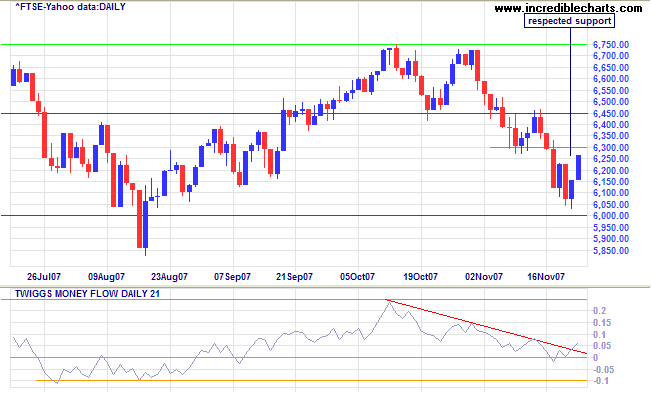
The FTSE 100 rallied after respecting support at 6000; expect short-term resistance at 6300. Reversal below 6000 would confirm a primary down-trend. Twiggs Money Flow shows short-term accumulation, but a fall below -0.1 would indicate that primary support (6000) is threatened.
India: Sensex
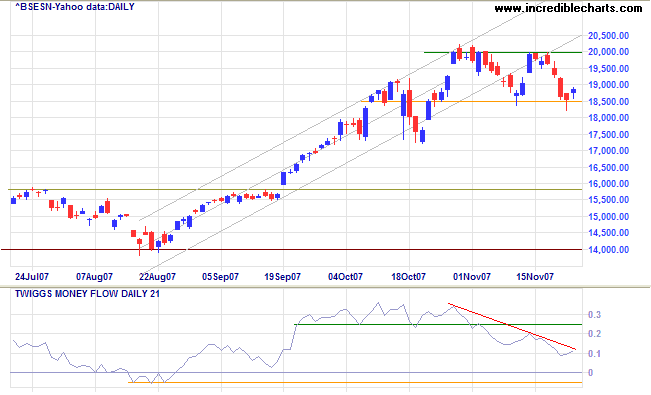
The Sensex respected resistance at 20000 and again reversed to test support at 18500. Failure of support would signal a secondary correction. Twiggs Money Flow recovery above 0.25 would be a bullish sign, while a fall below -0.05 would warn that primary support (at 14000) is likely to be tested.
Japan: Nikkei
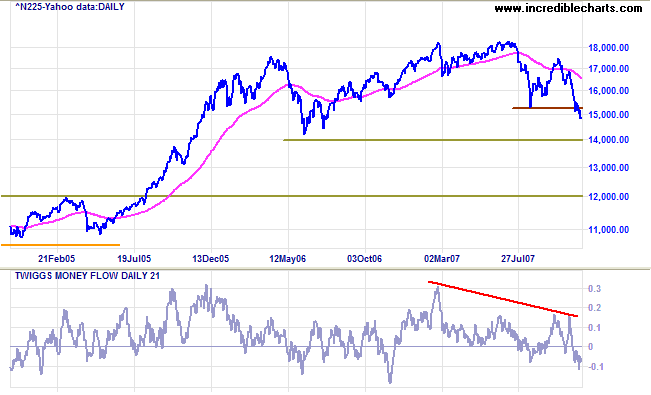
The Nikkei 225 started another primary down-swing after breaking below 15300. Expect support at 14000: the nearest round number to the 2006 low. Twiggs Money Flow signals strong distribution.
China: Hang Seng & Shanghai
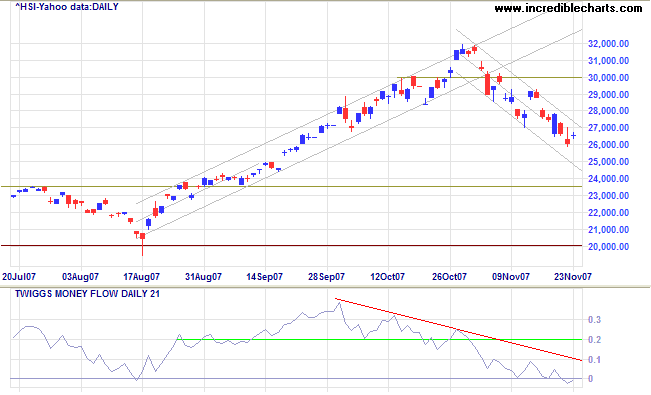
The Hang Seng is undergoing a strong secondary correction. Expect medium-term support at 23500, but Twiggs Money Flow below its August 2007 low warns of strong selling and primary support (20000) may well be tested.
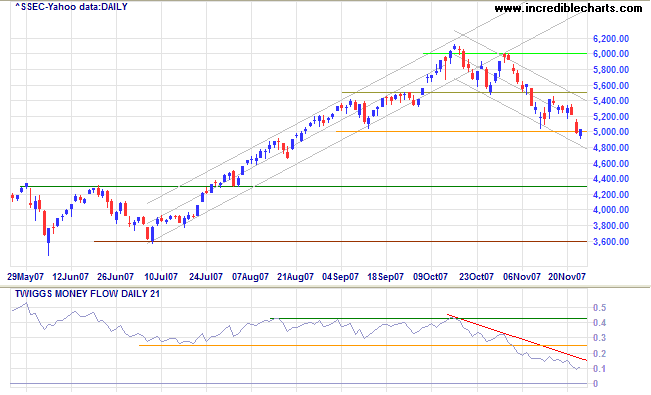
The Shanghai Composite crossed below 5000 warning of further weakness. Twiggs Money Flow below its July low warns of strong distribution and primary support at 3600 could well be tested. The market is in the final phase (stage 3) of a bull market.
Australia: ASX
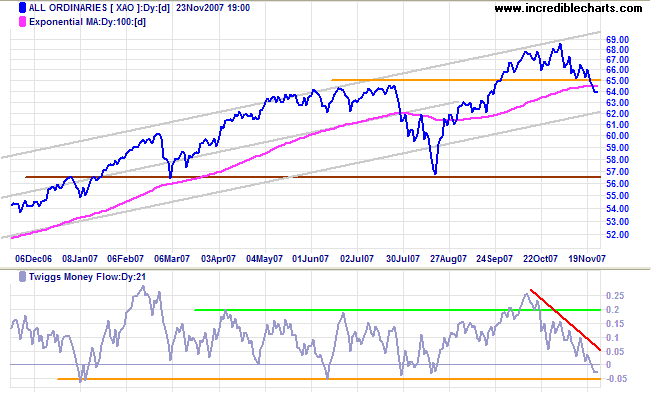
The All Ordinaries is headed for a test of the lower trend channel after breaking support at 6450/6500 (from the July 2007 high). Failure of the lower trend channel would warn that the primary up-trend has lost momentum and that a test of primary support at 5650 is imminent. A Twiggs Money Flow break below -0.05 would indicate that primary support is threatened.
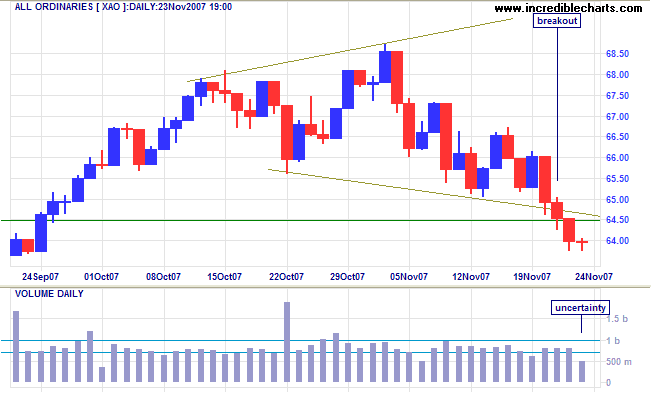
Short Term: Wednesday's breakout completed the
broadening top formation and signals the start of a secondary
correction. Thomas Bulkowski's
Encyclopedia of Chart Patterns suggests that a decline of
10% to 20% is likely for downward breakouts from a broadening
top pattern. The average decline is a little higher at 23%,
indicating that some breakouts carry a lot further.
Friday's doji accompanied by low volume reflect market
uncertainty, with US markets directionless ahead of the
Thanksgiving long weekend.
Faced with the choice between changing one's mind and proving
that there is no need to do so, almost everyone gets busy on
the proof.
~ John Kenneth Galbraith.
To understand my approach, please read Technical Analysis & Predictions in About The Trading Diary.

Author: Colin Twiggs is a former investment banker with almost 40 years of experience in financial markets. He co-founded Incredible Charts and writes the popular Trading Diary and Patient Investor newsletters.
Using a top-down approach, Colin identifies key macro trends in the global economy before evaluating selected opportunities using a combination of fundamental and technical analysis.
Focusing on interest rates and financial market liquidity as primary drivers of the economic cycle, he warned of the 2008/2009 and 2020 bear markets well ahead of actual events.
He founded PVT Capital (AFSL No. 546090) in May 2023, which offers investment strategy and advice to wholesale clients.
