Recession Warning
By Colin Twiggs
November 22, 2007 2:00 a.m. ET (6:00 p.m. AET)
These extracts from my trading diary are for educational purposes and should not be interpreted as investment advice. Full terms and conditions can be found at Terms of Use.
Dow Under Threat
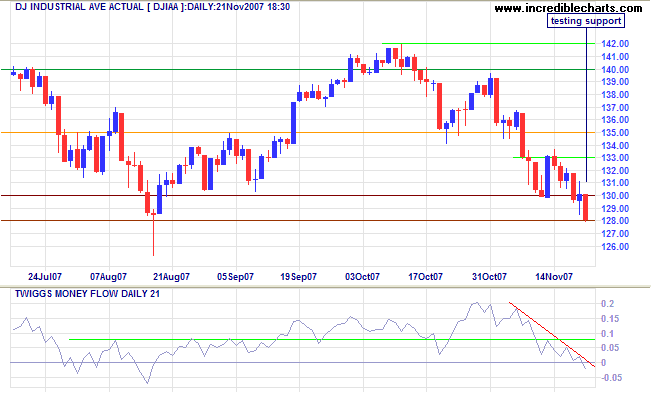
The Dow is testing primary support at 12800; failure of this level (a close below 12800) would signal a primary down-trend. We might see a a few days of consolidation above the support level, but I am convinced that the economy is headed for a recession — and will take the stock market along with it.
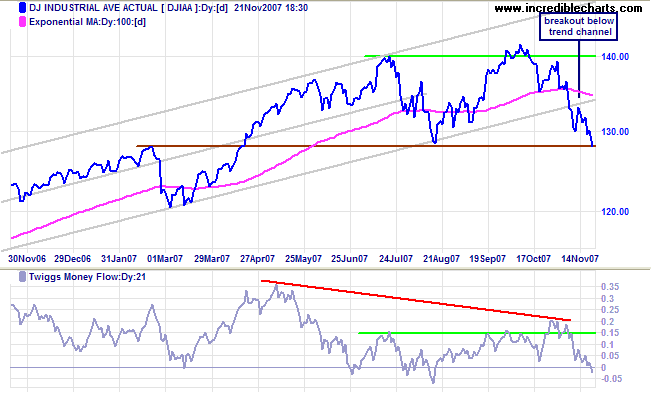
In a larger time frame, there is a clear breakout below the long-term trend channel, while Twiggs Money Flow shows a large bearish divergence.
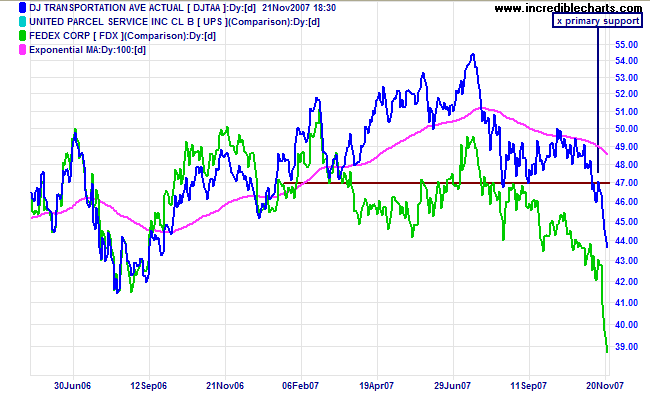
The Dow Jones Transport index started a primary down-trend after breaking support at 4700; so a Dow Industrial close below 12800 would signal the start of a bear market. Fedex, often a lead indicator for the general index, has also dived after breaking long-term support at $100.
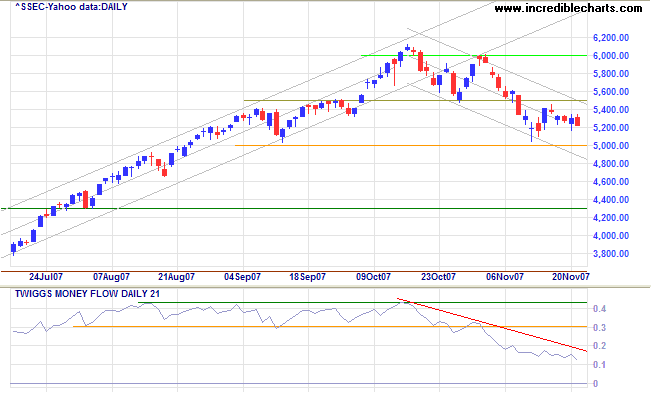
If you buy the line that "This time it's different because of
China", and believe that other markets will not be as badly
affected, ask yourself: "Who is China's biggest customer
— who do they sell most of their manufactured goods
to?"
A Shanghai Composite fall below 5000 would signal that the
secondary correction is likely to continue.
The Yield Curve
The yield curve remains our most accurate tool for predicting
recessions. The only problem is that signals can occur 12 to 18
months in advance of a down-turn — leaving plenty of time
for doubts to grow as the market keeps rising.
Here is an update of the chart published on January 10, 2007.
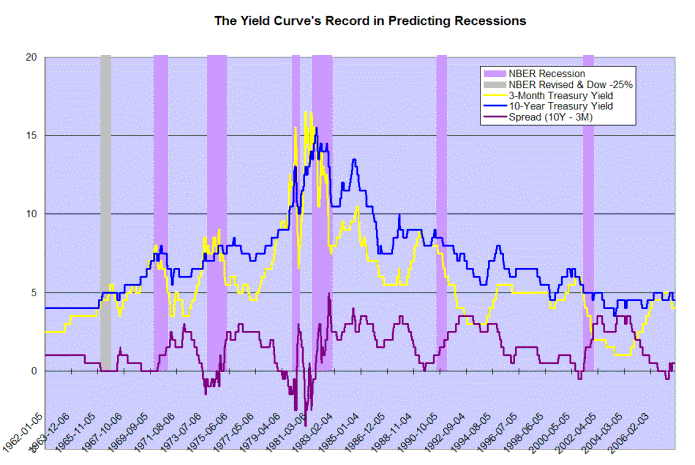
Every time there has been a significant rise in short-term interest rates over the last 45 years, a recession has followed — except on those rare occasions where long-term rates have shown a corresponding rise, maintaining a positive yield curve. In a nutshell: whenever the yield spread (maroon line) falls to zero, a recession follows.
My conclusion from the January 2007 newsletter still stands: It is likely, however, that we will witness a market down-turn in the next 12 months. We will need to remain vigilant throughout 2007 -- particularly in October, the start of several previous down-turns.
Treasury Yields
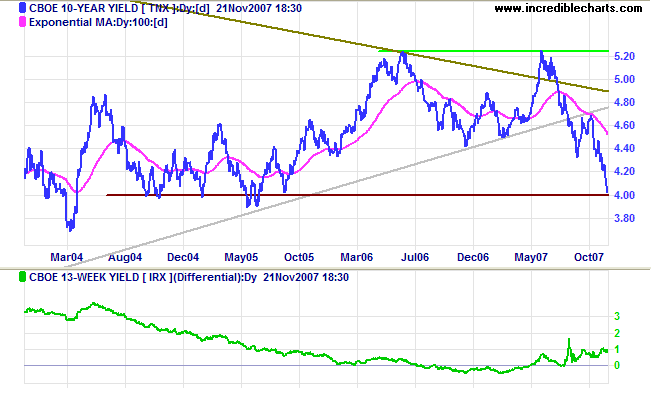
Ten-year treasury yields are falling sharply in anticipation of further rate cuts from the Fed. The yield differential (10-year minus 3-month treasury yields) recovered to nearly 1 per cent, but the damage had already been done in late 2006 and early 2007, when the spread fell below zero.
Financial Markets
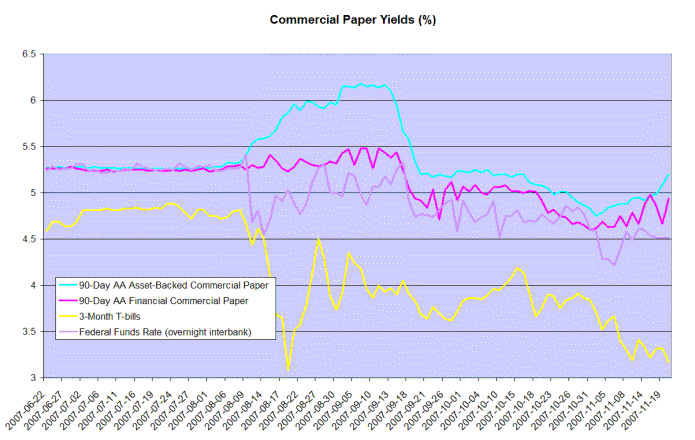
Treasury bill (3-month) yields are testing support at 3.00%, while rates on asset-backed securities and financial paper are rising. The widening spread warns of further upheaval in financial markets.
The subprime contagion appears to be spreading to commercial
real estate and the bond insurance industry. Commercial real
estate values have started to falter as banks tighten their
credit criteria; and any downgrade of bond insurers will affect
the ratings of a wide range of corporate and municipal bonds,
forcing a sell-off by large investors such as pension funds,
required by law to hold only investment grade assets.
Last but not least is the re-valuation of banks' Level 3 assets
(assets which do not have a ready market) in accordance with
amended accounting rule FASB 157 which came into effect on
November 15. For the first time, this financial year-end,
auditors will have to ensure that Level 3 valuations reflect
fair value (mark-to-market) rather than mark-to-model, or
mark-to-make-believe as some prefer to call it. Expect
further write-downs, but the real concern is that Level 3
assets of many major banks far exceed their total reserves
(many thanks to Peter Warde for this informative link).
Some banks have already started applying the new accounting
rule — so the impact is difficult to gauge, but a 25%
write-down of Level 3 assets would change the banking system as
we know it.
I believe that Jonathan Wright's recession prediction model has failed to adequately address the damage caused by a negative yield curve in a low interest rate environment. The model currently reflects probability of a recession in the next four quarters as a low 15 percent.
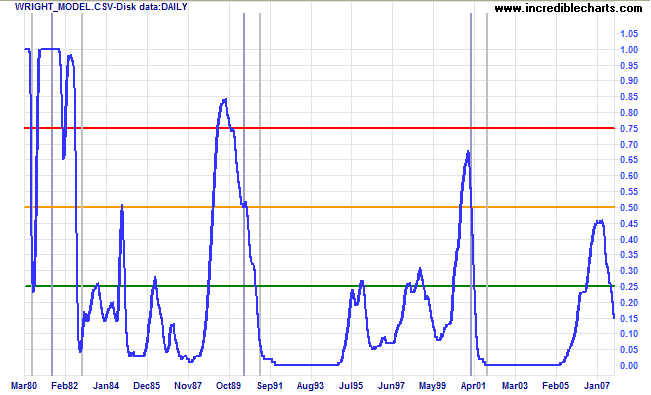
The model's weakness is the lack of available data, with only one similar period of low interest rates in the 1960s and a "phantom" recession in 1966 which his model does not consider: certified by the NBER, the recession was revised away several years later, despite a 25% fall on the Dow.
It was the same with all. They would not take a small loss at
first but held on, in the hope of a recovery that would "let
them out even". And prices had sunk and sunk until the loss was
so great that it seemed only proper to hold on, if need be a
year, for sooner or later prices must come back. But the break
"shook them out" and prices just went so much lower because so
many people had to sell, whether they would or not.
~ Edwin Lefevre
To understand my approach, please read Technical Analysis & Predictions in About The Trading Diary.

Author: Colin Twiggs is a former investment banker with almost 40 years of experience in financial markets. He co-founded Incredible Charts and writes the popular Trading Diary and Patient Investor newsletters.
Using a top-down approach, Colin identifies key macro trends in the global economy before evaluating selected opportunities using a combination of fundamental and technical analysis.
Focusing on interest rates and financial market liquidity as primary drivers of the economic cycle, he warned of the 2008/2009 and 2020 bear markets well ahead of actual events.
He founded PVT Capital (AFSL No. 546090) in May 2023, which offers investment strategy and advice to wholesale clients.
