Dow Ticks Up But China Down
By Colin Twiggs
October 27, 2007 4:30 a.m. ET (6:30 p.m. AET)
These extracts from my trading diary are for educational purposes and should not be interpreted as investment advice. Full terms and conditions can be found at Terms of Use.
USA
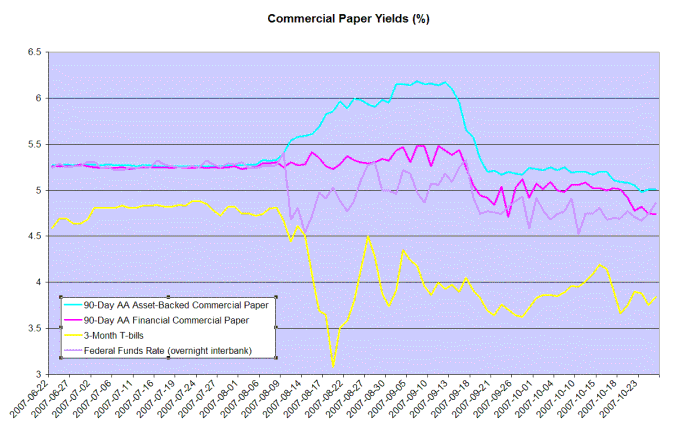
Last week saw a slight up-tick in commercial paper outstanding, but the wide spread between treasury bill yields and commercial paper continues to reflect investors' aversion to risk.
Dow Jones Industrial Average
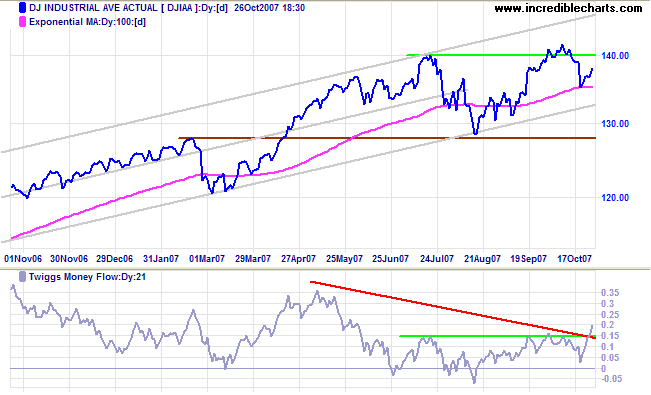
The Dow Jones Industrial Average found strong support at 13500 and is now headed for a test of the key 14000 resistance level. Breakout above the all-time high (14200) would confirm the next target of 15000 [14000+(14000-13000)]. I have rounded the figures as the Dow tends to move in steps of 1000.
Twiggs Money Flow signals strong short-term accumulation, but the long-term bearish divergence remains.
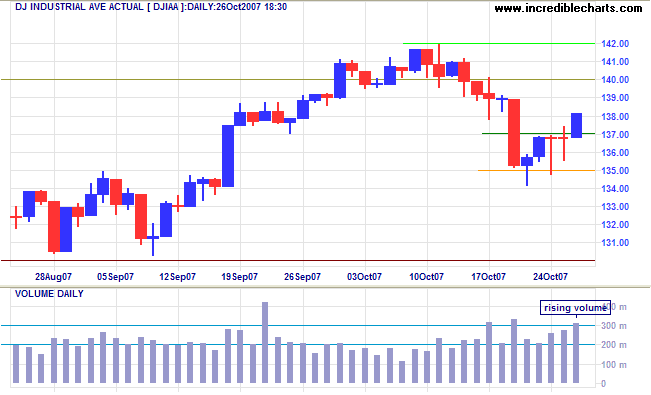
Short Term: Long tails and rising volume signaled buying support during the week and the breakout above 13700 indicates another test of resistance at 14000/14200. Reversal below 13500 is now unlikely — and would signal a test of primary support at 12800.
Transport
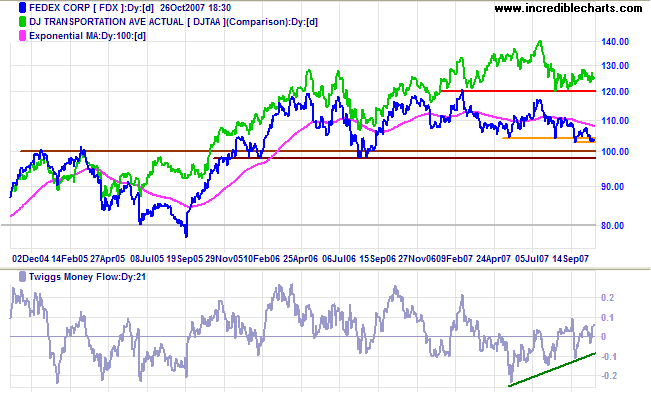
Fedex is headed for a test of support at $100, dragging the Dow Jones Transportation Average towards a test of primary support at 4700. Twiggs Money Flow shows a bullish divergence, however, indicating that support is likely to hold. A Fedex fall below $100/$98, though not expected, would be a bear signal for the broader economy.
Small Caps & Technology
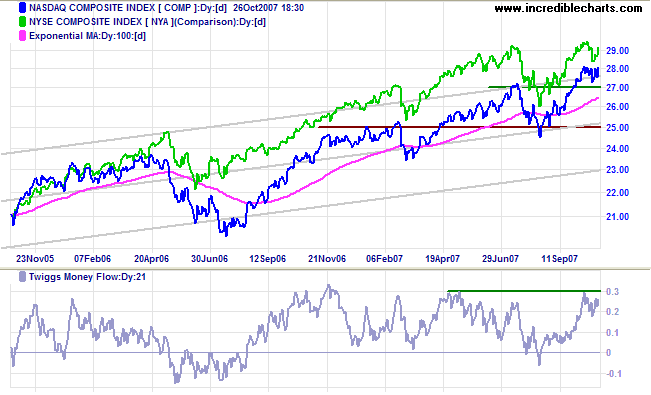
The Nasdaq Composite shows a bullish consolidation above support at 2700. Breakout above 2800 would offer a target of 2950 [2700+(2700-2450)]. Twiggs Money Flow breakout above 0.3 would also be a bullish sign. Reversal below 2700, though unlikely, would warn of another correction.
The NYSE Composite lags behind the Nasdaq, but is also positive.
S&P 500
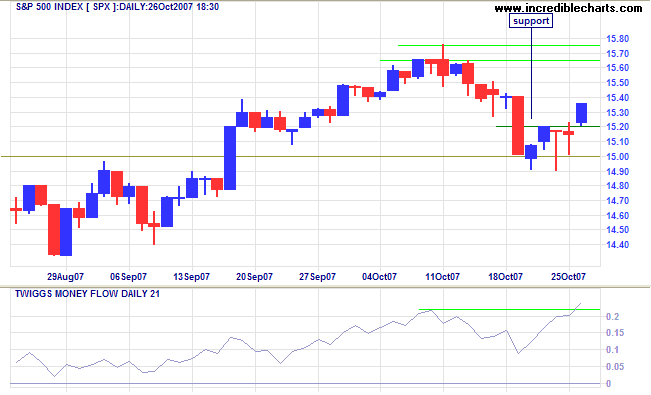
The S&P 500 found support at 1500 and is headed for a test of resistance at 1565/1575. Twiggs Money Flow signals strong accumulation and a rise above 1575 would confirm the target of 1700 [1550+(1550-1400)]. Reversal below 1500 is not expected — and would signal a test of primary support at 1400.
United Kingdom: FTSE
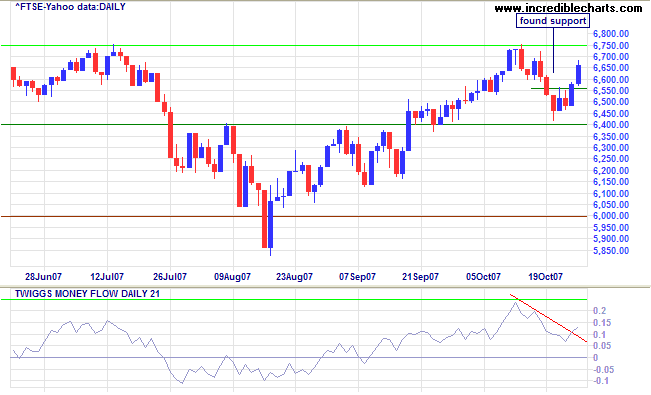
The FTSE 100 found support at 6400 and is now headed for another test of 6750. Twiggs Money Flow remains weak and reversal below the week's low would be a bear signal — as would an index fall below 6400. Breakout above 6750 is equally likely, however, and would signal a test of the all-time high of 6930.
India: Sensex
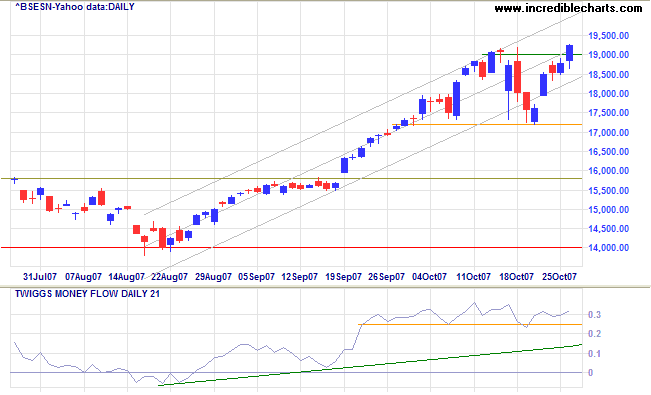
After respecting support at 17300, the Sensex broke through resistance at 19000, signaling a test of the upper trend channel. Twiggs Money Flow shows accumulation. Primary support remains a long way below at 14000.
Japan: Nikkei
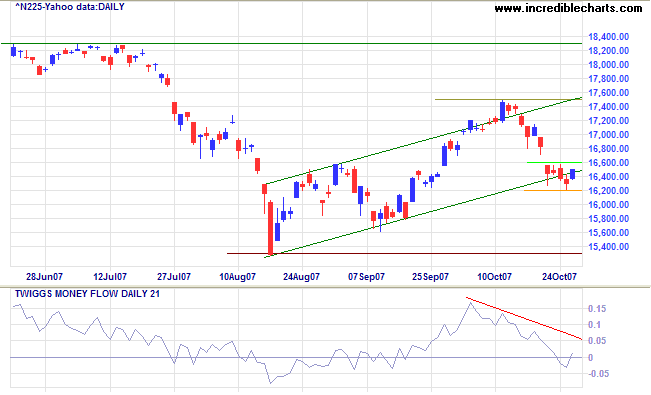
The Nikkei 225 is consolidating at the lower trend channel border, between 16200 and 16600 . Reversal above the key 16600 level (the March 2007 primary low) would signal a test of 18300; while failure of support at 16200 would warn of a test of primary support at 15300. Bearish divergence on Twiggs Money Flow continues to signal (medium term) distribution.
China: Hang Seng & Shanghai
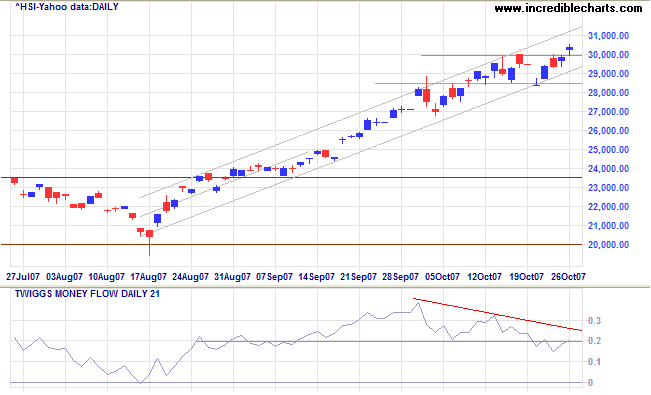
The Hang Seng broke through 30000, signaling a test of the upper trend channel border. Bearish divergence on Twiggs Money Flow, and penetration of support at 0.2, both warn of a correction. The index is a long way above primary support at 20000.
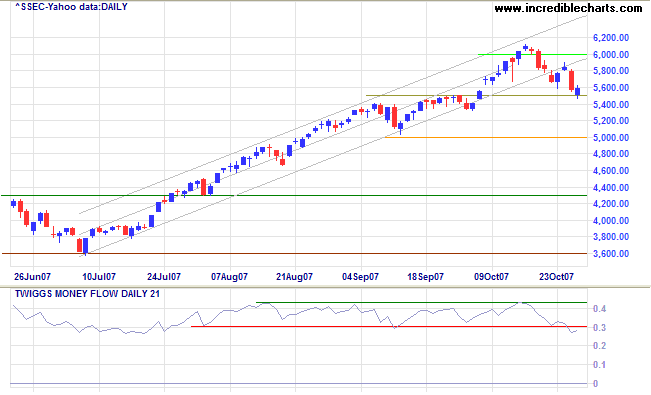
The Shanghai Composite Index retreated below support at 5600 after a failed attempt at 6000. Breakout below the trend channel warns of a secondary correction and a close below 5500 would confirm. Twiggs Money Flow signals (short-term) distribution. Shanghai is in the final phase of a bull market and, with primary support a long way below at 3600, may be prone to a sharp fall.
Australia: ASX
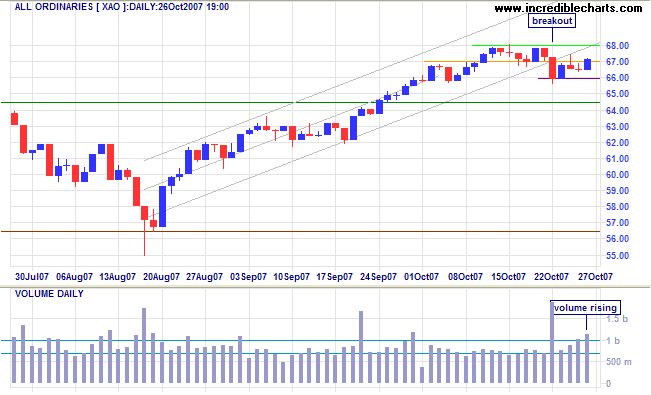
The All Ordinaries is consolidating near the upper border of the trend channel, while Twiggs Money Flow has fallen sharply, warning of distribution. Recovery (of TMF) above 0.2, or a breakout above 6800, would be a bullish sign, but a down-swing to the lower channel border is equally likely.
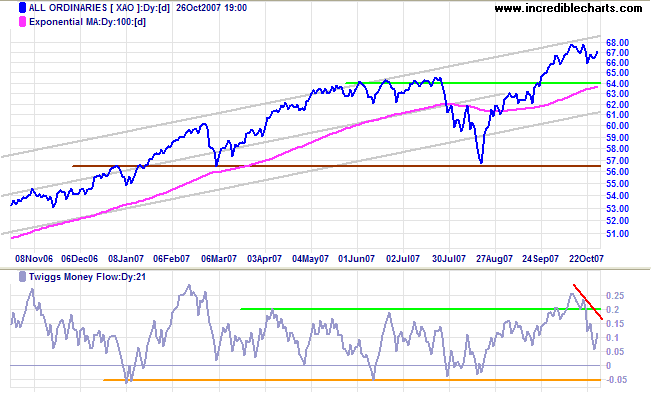
Short Term: Breakout below the (medium term) trend channel warns of a secondary correction — confirmed if there is a close below 6600. Rising volume indicates strong opposition between buyers and sellers and breakout could result in a sharp advance or decline.
I have two great enemies, the southern army in front of me and
the financial institutions, in the rear. Of the two, the one in
the rear is the greatest enemy.....
I see in the future a crisis approaching that unnerves me and
causes me to tremble for the safety of my country. As a result
of the war, corporations have been enthroned and an era of
corruption in high places will follow, and the money power of
the country will endeavor to prolong its reign by working upon
the prejudices of the people until wealth is aggregated in a
few hands and the Republic is destroyed. I feel at this moment
more anxiety for the safety of my country than ever before,
even in the midst of the war.
~ Abraham Lincoln
To understand my approach, please read Technical Analysis & Predictions in About The Trading Diary.

Author: Colin Twiggs is a former investment banker with almost 40 years of experience in financial markets. He co-founded Incredible Charts and writes the popular Trading Diary and Patient Investor newsletters.
Using a top-down approach, Colin identifies key macro trends in the global economy before evaluating selected opportunities using a combination of fundamental and technical analysis.
Focusing on interest rates and financial market liquidity as primary drivers of the economic cycle, he warned of the 2008/2009 and 2020 bear markets well ahead of actual events.
He founded PVT Capital (AFSL No. 546090) in May 2023, which offers investment strategy and advice to wholesale clients.
