Gold, Oil, Currencies & Interest Rates
By Colin Twiggs
August 28, 2007 8:40 p.m. EST (10:40 a.m. AEST)
These extracts from my trading diary are for educational purposes and should not be interpreted as investment advice. Full terms and conditions can be found at Terms of Use.
Gold
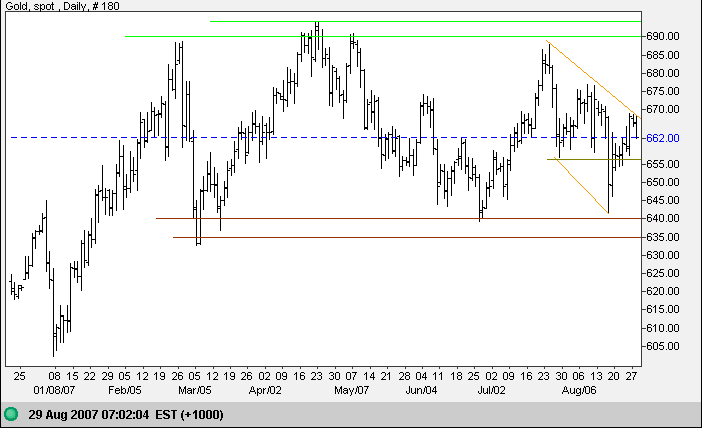
Spot gold reversed at $670, confirming a downward trend channel that is likely to test primary support at $640. A fall below $656 (from the July 27 low) would strengthen the signal. In the longer term, gold continues to range between resistance at $690 and support at $640; only a failed swing or breakout will indicate future direction.
Source: Netdania
Crude Oil
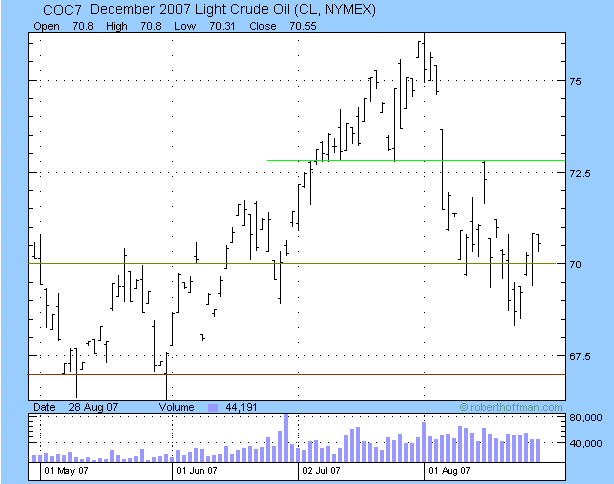
December Light Crude recovered to above the recently-penetrated support level of $70, indicating that the down-trend is weakening. Respect of $70 by the next retracement would be a positive sign, but only a rise above $73 would signal that the down-trend has ended and confirm that the primary up-trend is intact. Failure of support at $67 remains just as likely, and would warn of a test of the January 2007 low of $55.
Currencies
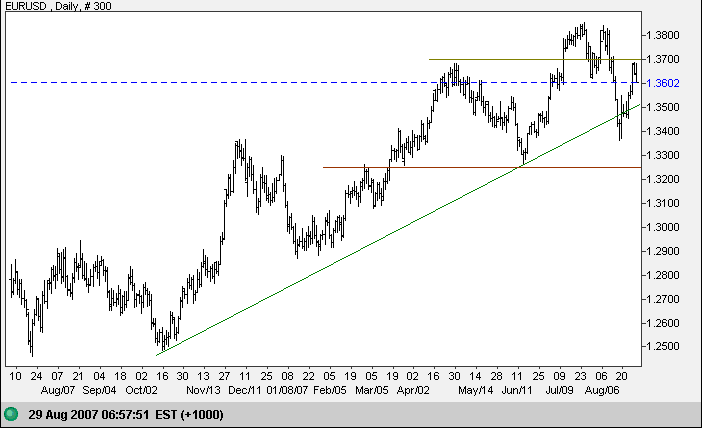
The euro respected resistance at the April high of $1.37. Retreat below $1.36 would signal another test of the long-term rising trendline. Reversal above $1.37 is less likely and would indicate a test of resistance at $1.3800/$1.3850. The primary trend remains intact unless support at $1.3250 is broken.
Source: Netdania
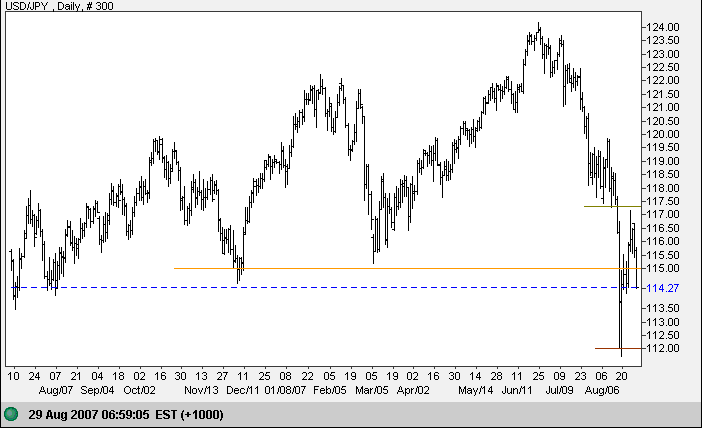
The dollar is whipsawing around the former primary support level of 115 against the yen, the high volatility signaling uncertainty. Expect a primary down-trend to test long-term support at 100 as carry trades are unwound. A fall below support at 112 would confirm this, while a rally above 117/117.50 (though less likely) would indicate that the down-trend is failing.
Source: Netdania
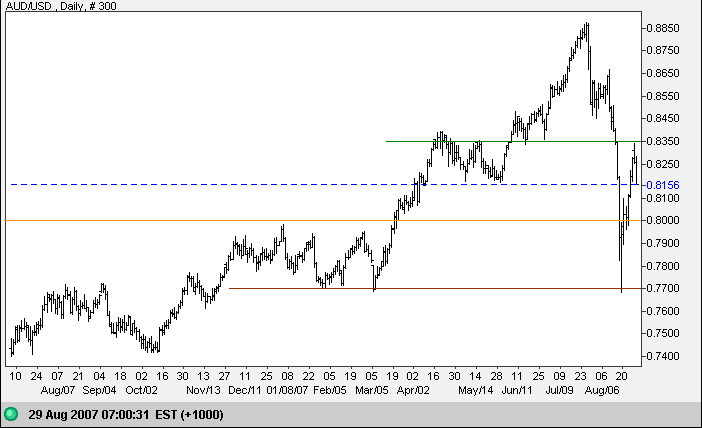
The Australian dollar also displays high volatility: rallying sharply before respecting support at 0.8350. Respect of the former primary support level of 0.8150 would be a bullish sign, but we are likely to see another test of key support at 0.8000. Respect of 0.8000 would be a weaker bull signal, while failure of support would confirm the primary down-trend. The latter scenario remains most likely as it goes with the prevailing trend, rather than against it.
Source: Netdania
Treasury Yields
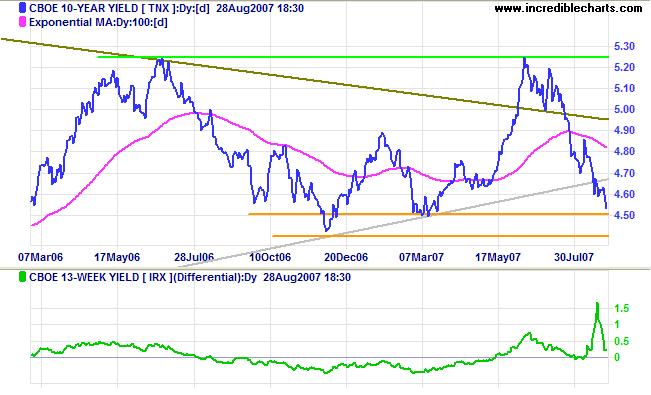
Ten-year treasury yields are testing support at 4.50%. Expect
further consolidation between 4.50% and 5.25% as the 2003 -
2007 up-trend converges with the downward trendline from the
20-year super-cycle. Breakout below 4.50%/4.40% would indicate
that the super-cycle down-trend is intact.
The yield differential (10-year minus 13-week treasury yields)
reversed sharply as T-Bill yields recovered, but concern over
tightening bank credit remains.
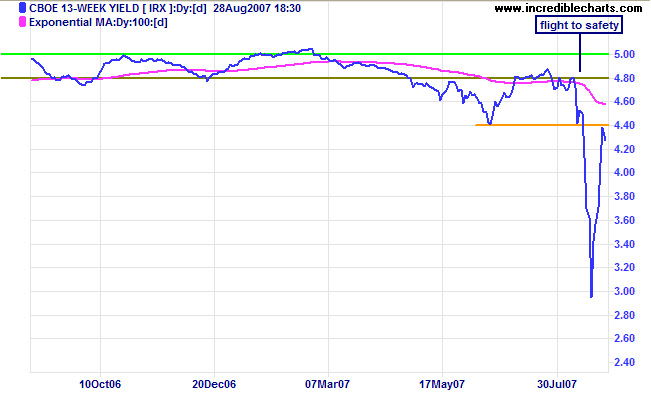
Short-term (13-week) treasury yields have recovered from last week's panic, but remain in a strong down-trend if resistance at 4.40% is respected.
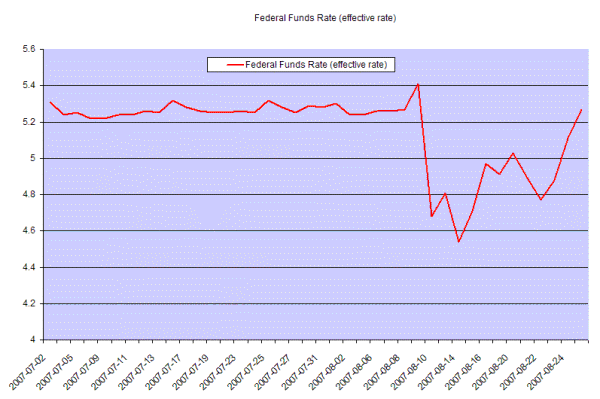
The effective federal funds rate recovered to 5.27%, indicating that the Fed is no longer injecting liquidity into the financial markets. This also means that prospects for a cut in the federal funds rate (at the next FOMC meeting on September 18) are fading. The full effect of the sub-prime crisis has not yet been felt and it will take several months before we see the real impact on earnings. The level of adjustable rate mortgages to be reset (at the end of their "honeymoon" period) will increase in September before peaking in October 2007 at $50 billion, according to Credit Suisse —and the level will remain above $30 billion per month for the next year. Total ARMs due to be reset over 2007 and 2008 exceed $1 trillion, so the eventual cost to the financial sector may well exceed $100 billion.
Stock Markets
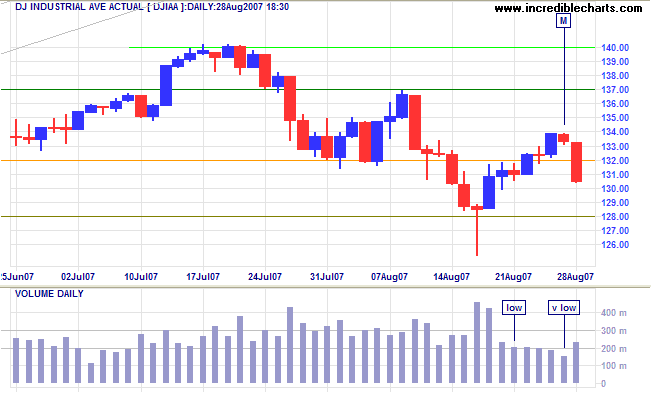
Low volumes on the Dow Jones Industrial Average indicated little interest in last week's rally which finally petered out on Monday. Expect another test of 12800, while a fall below the August low would signal a test of primary support at 12000.
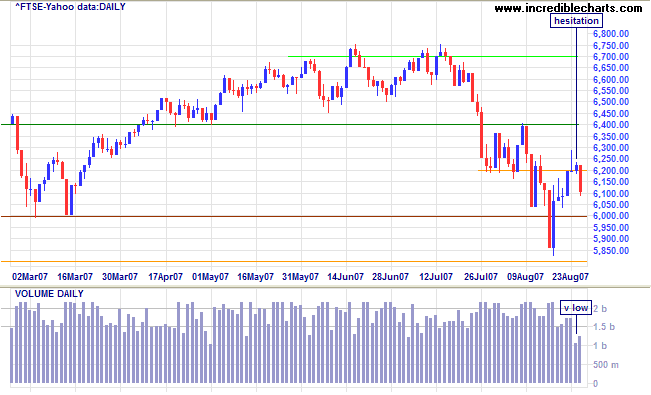
The Nikkei has failed to recover above the former primary support level of 16600 and respect of this level would confirm a strong down-trend. The FTSE 100 faltered at 6200 and is headed for another test of primary support at 6000. A close below 6000 would confirm the (primary) down-trend. The Hang Seng is hesitating at 23500 and is likely to retrace in sympathy with the Dow. The Shanghai Composite index, on the other hand, continues to charge ahead undaunted, having exceeded its target of 5000 —but we should expect some (slight?) retracement in sympathy with other markets.
Wright Model
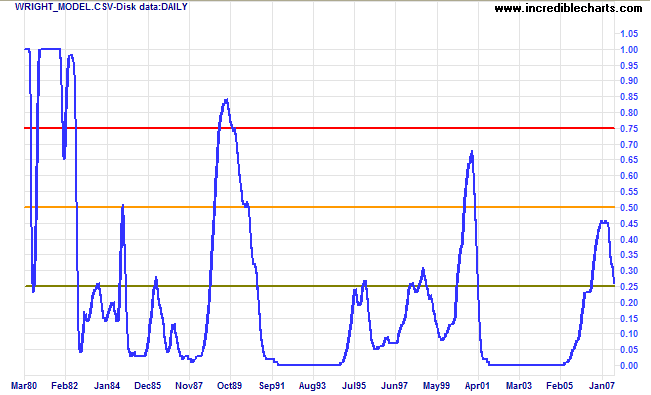
Probability of recession in the next four quarters fell to 26 per cent according to the Wright Model.
The man who is right always has two forces working in his favor
—basic conditions and the men who are wrong.
~ Jesse Livermore in Reminiscences of a Stock Operator by Edwin Lefevre.
To understand my approach, please read Technical Analysis & Predictions in About The Trading Diary.

Author: Colin Twiggs is a former investment banker with almost 40 years of experience in financial markets. He co-founded Incredible Charts and writes the popular Trading Diary and Patient Investor newsletters.
Using a top-down approach, Colin identifies key macro trends in the global economy before evaluating selected opportunities using a combination of fundamental and technical analysis.
Focusing on interest rates and financial market liquidity as primary drivers of the economic cycle, he warned of the 2008/2009 and 2020 bear markets well ahead of actual events.
He founded PVT Capital (AFSL No. 546090) in May 2023, which offers investment strategy and advice to wholesale clients.
