The Fed Steps In - Again
By Colin Twiggs
August 18, 2007 6:30 a.m. EST (8:30 p.m. AEST)
These extracts from my trading diary are for educational purposes and should not be interpreted as investment advice. Full terms and conditions can be found at Terms of Use.
USA: Dow, Nasdaq and S&P500
The Federal Reserve cut the discount rate to 5.75 percent from
6.75 percent. This is a symbolic action as the discount window
is nowadays rarely used, but it does indicate that a cut in the
fed funds rate is being considered. The discount rate is the
overnight rate at which the Fed lends to banks if they have a
shortfall, while the more widely used fed funds rate (5.25%) is
the lower rate at which banks lend overnight to each
other.
While the Fed's actions will ensure the stability of the
banking system it is unlikely to reverse the course of the
market. Banks are likely to re-assess their risk exposure and
many forms of credit will become more expensive. Tighter credit
will affect sales - so there may well be a long term effect,
but it will take months before we can assess the impact on
earnings.
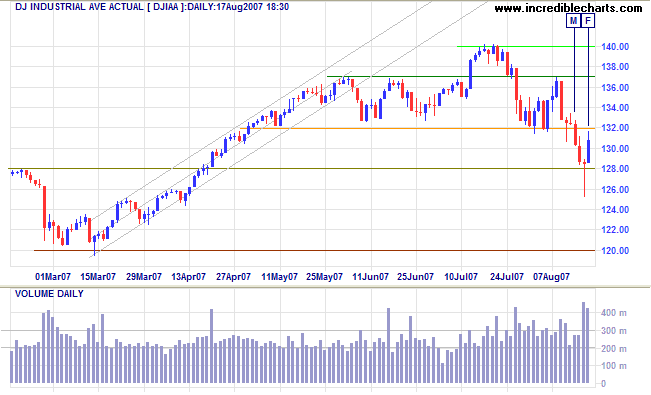
The Dow Jones Industrial Average tested the lower border
of the trend channel at 12800 before recovering sharply. Sharp
rallies in a bear-trend cannot be trusted and we should wait
for a second test that respects the lower channel border.
Twiggs Money Flow continues with a large bearish
divergence; a break of the downward trendline would indicate
that distribution is ending.
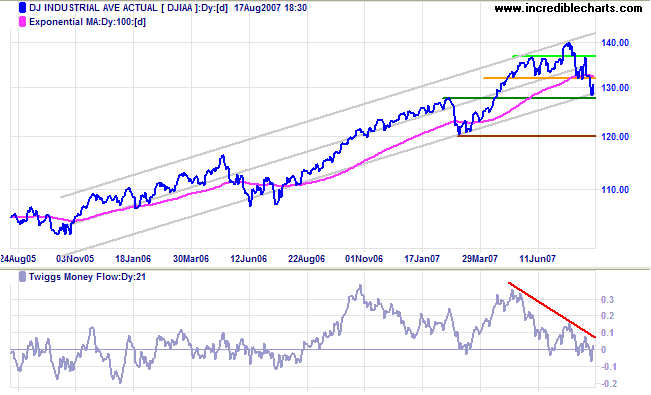
Long Term: The primary trend remains up.
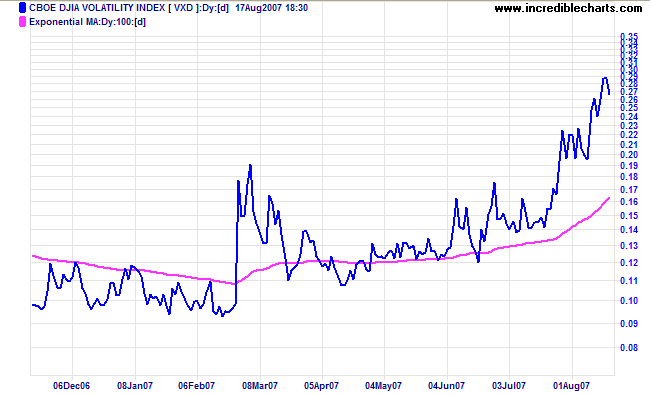
Short Term: Volatility remains high, warning of further instability before the market settles. Further oscillation between resistance at 13700 and support at 12800 is likely. A rise above 13700 would signal that the correction has ended, while a fall (intra-day) below 12800 would signal another down-swing.
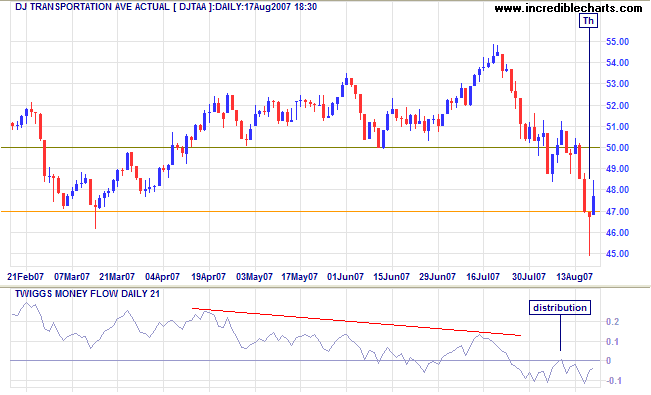
The Dow Jones Transportation Average closed below primary support at 4700 on Thursday, signaling reversal to a down-trend. Recovery above 5000, however, would indicate that this was a false break. Fedex displayed a similar bearish pattern while UPS remains in an up-trend. A Fedex fall below $100 or a UPS fall below $67 would be a long-term bear signal for the economy.
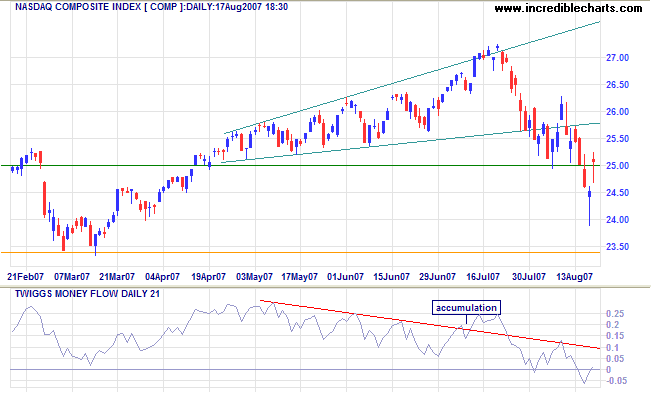
The Nasdaq Composite broke through 2500, warning of a
test of primary support at 2340. Twiggs Money Flow whipsawing
around zero signals short-term uncertainty, but the long-term
outlook is bearish.
Long Term: The primary trend is up.
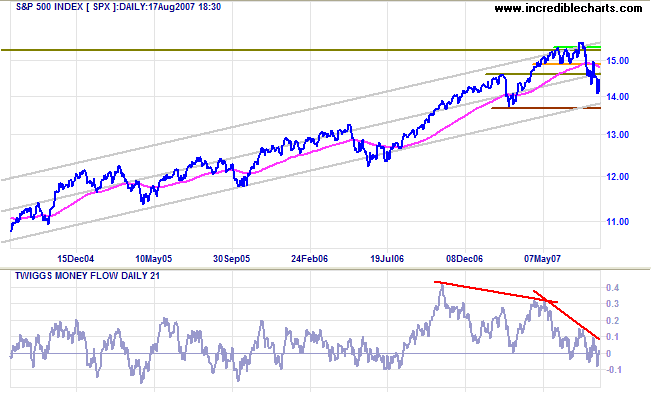
The S&P 500 tested primary support at 1375 before
making a sharp recovery. Volatility is high, however, and sharp
rallies in a bear trend are not to be trusted. A rise above
1500 would signal that the correction has ended, but another
test of primary support remains just as likely. Twiggs Money
Flow signals short-term uncertainty, but the long-term outlook
is bearish.
Long Term: The primary trend remains up.
LSE: United Kingdom
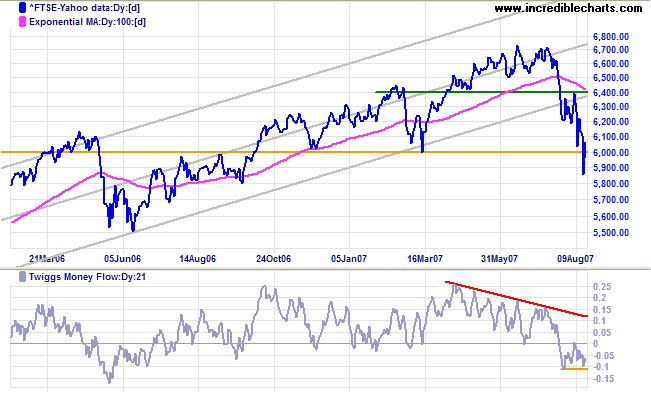
The FTSE 100 broke through primary support at 6000,
signaling reversal to a down-trend, but immediately reversed
above the former support level. A rise above 6400 would
indicate that this was a false break, while retreat below 6000
would confirm the down-trend. Twiggs Money Flow remains bearish
and a fall below -0.1 would signal further distribution; a rise
above zero, on the other hand, would indicate recovery.
Long Term: We have a signal that the primary trend has
reversed, but I would wait for confirmation. The signal is weak
because:
- this is a large correction, rather than a lower high followed by a new low;
- the price earnings ratio is low at 14;
- the index immediately retreated above the former support level.
Japan: Nikkei
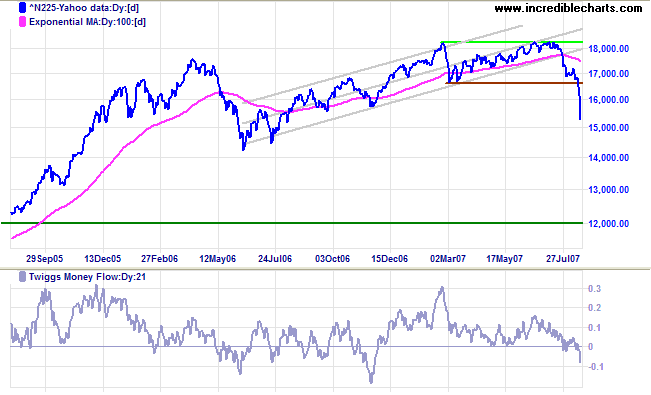
The Nikkei 225 gives a clear signal of a trend reversal
after breaking through primary support at 16600. Compare this
to the FTSE 100 - no new high was made so this is not a
large correction.
Twiggs Money Flow signals strong distribution.
Long Term: The primary trend has reversed to
down.
China: Hang Seng & Shanghai
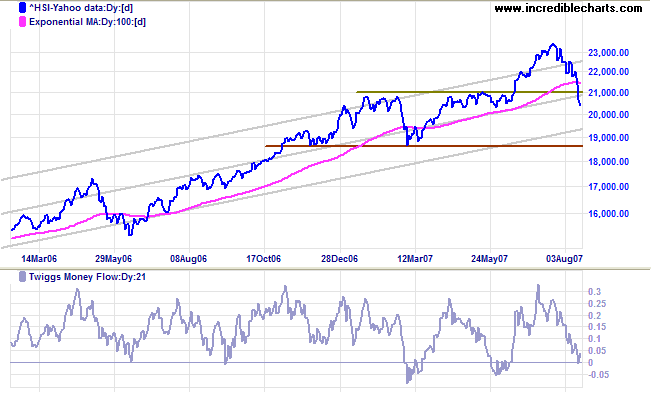
The Hang Seng broke through support at 21000 and appears headed for a test of the lower trend channel, despite a weak close on Friday. The primary trend remains up, with support at 18600. A Twiggs Money Flow fall below the March 2007 low would be bearish.
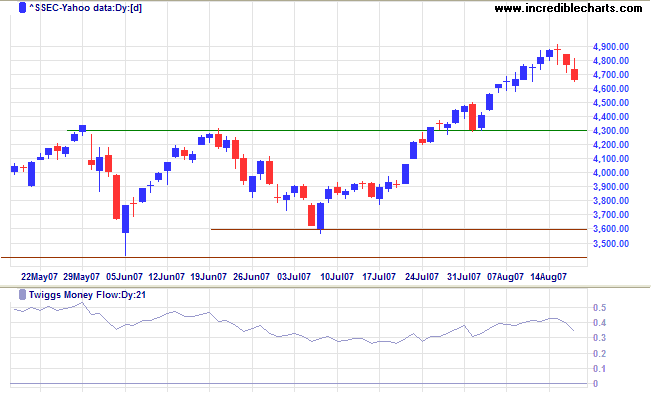
The Shanghai Composite remains strongly bullish, retracing only 3 days despite the turmoil elsewhere. Expect further retracement, but the target remains at 5000 (4300+[4300-3600]). The price earnings ratio is high at 26, warning that the bull market has entered stage 3.
ASX: Australia
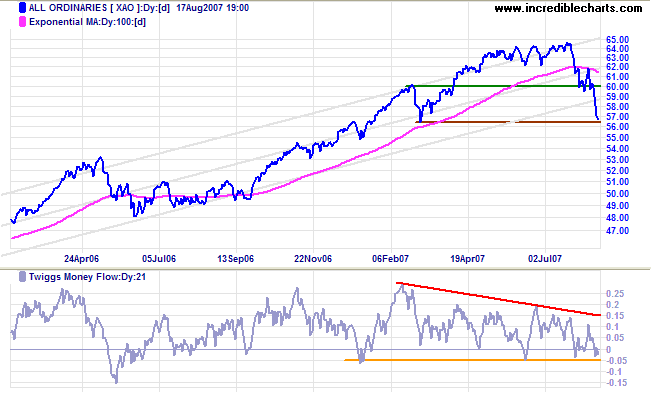
The All Ordinaries is testing primary support at 5650.
Twiggs Money Flow (21-day) is testing support at -0.05 and
a fall through this level would be bearish.
Long Term: The primary trend remains up, but a close
below 5650 would signal a trend reversal. I believe that the
bull market is in stage 3 despite the modest price earnings
ratio.
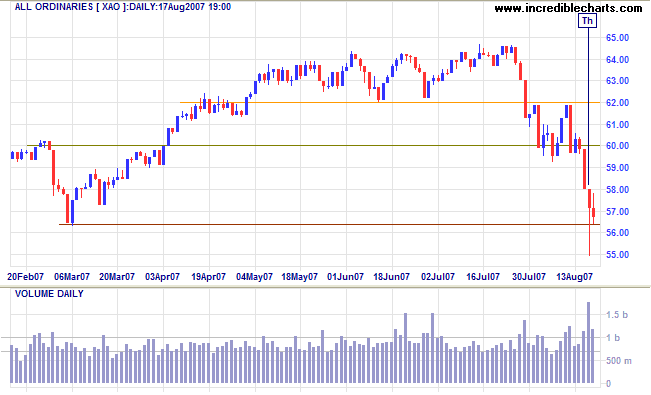
Short Term: Expect an early rally on Monday, following Friday's positive close in US markets, but volatility is high and sharp rallies are not to be trusted. A rise above 6200 would signal that the correction is over, but a close below primary support at 5650 remains just as likely.
It's not whether you are right or wrong that matters, but how
much money you make when you're right and how much you don't
lose when you're wrong.
~ George Soros
To understand my approach, please read Technical Analysis & Predictions in About The Trading Diary.

Author: Colin Twiggs is a former investment banker with almost 40 years of experience in financial markets. He co-founded Incredible Charts and writes the popular Trading Diary and Patient Investor newsletters.
Using a top-down approach, Colin identifies key macro trends in the global economy before evaluating selected opportunities using a combination of fundamental and technical analysis.
Focusing on interest rates and financial market liquidity as primary drivers of the economic cycle, he warned of the 2008/2009 and 2020 bear markets well ahead of actual events.
He founded PVT Capital (AFSL No. 546090) in May 2023, which offers investment strategy and advice to wholesale clients.
