Gold, Oil, Currencies & Interest Rates
By Colin Twiggs
August 7, 2007 3:30 a.m. EST (5:30 p.m. AEST)
These extracts from my trading diary are for educational purposes and should not be interpreted as investment advice. Full terms and conditions can be found at Terms of Use.
Gold
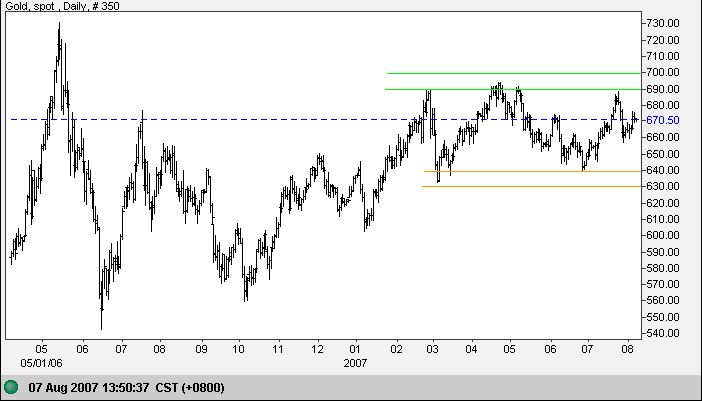
Spot gold is retracing after a down-swing to $660, mid-way between resistance at $690 and support at $640. A rally to test the upper border of the large consolidation would be a bullish sign, suggesting an upward breakout. No rally would mean that a downward breakout is equally likely.
Source: Netdania
Crude Oil
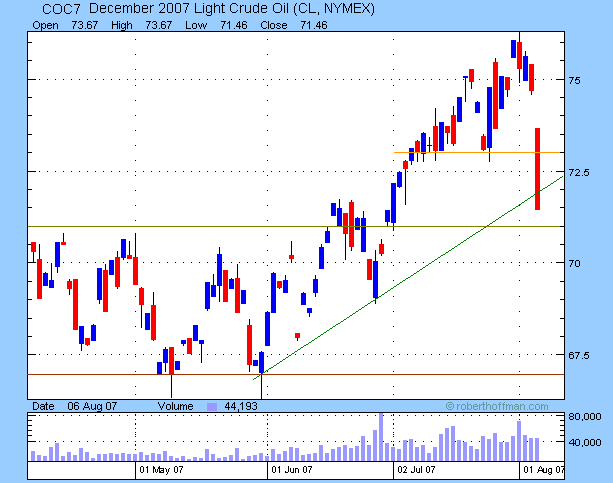
December Light Crude gapped down sharply to test the medium-term rising trend line. Expect some support at $71, with stronger support at $67. Failure of $67 would signal a test of the January 2007 low of $55.
Currencies
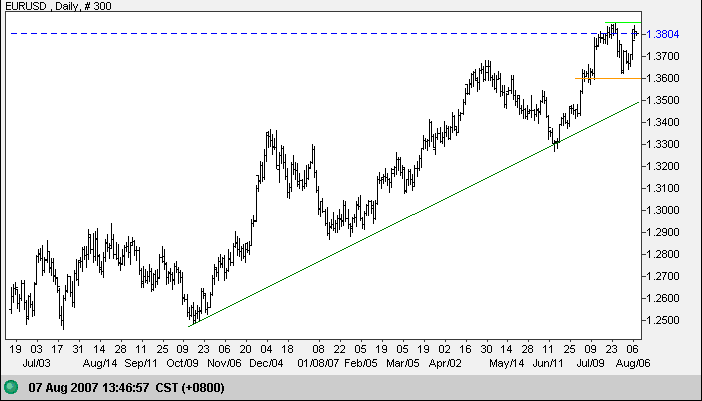
The euro found support at $1.37/$1.36 and has rallied to test resistance at the earlier high of $1.3850. Breakout would offer a target of $1.41 (1.385+[1.385-1.36]), coinciding with the medium term target (1.37+[1.37-1.33]). Respect of resistance is less likely - and would signal a test of the rising trendline.
Source: Netdania
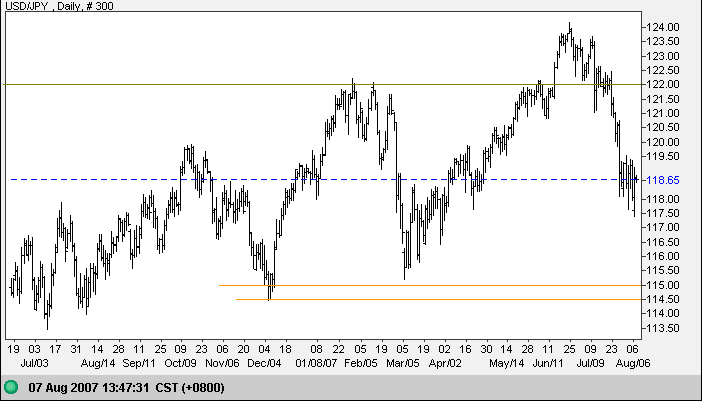
The dollar is consolidating after a sharp fall against the yen. A test of primary support at 115/114.50 remains likely.
Source: Netdania
The Australian dollar is consolidating at the rising trendline after a sharp fall against the greenback. Breakout below 0.8450 would signal trend weakness, warning of a possible reversal, but an upward breakout remains equally likely, signaling another test of resistance at 0.89.
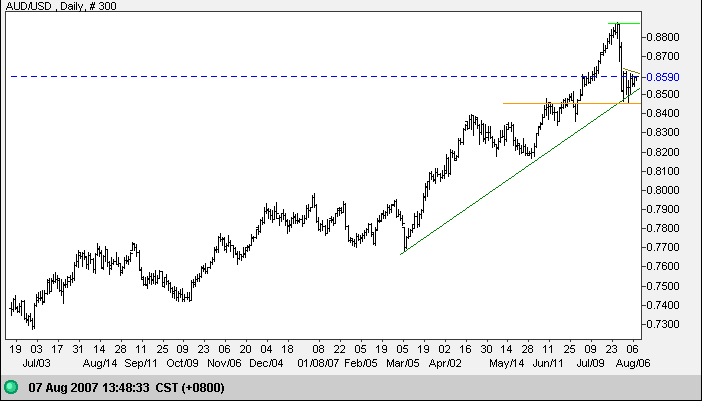
Source: Netdania
Treasury Yields
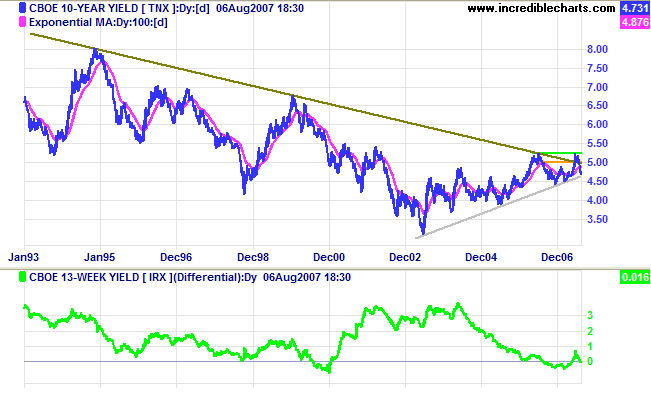
The ten-year treasury yield is approaching a watershed, with a
well-defined trend from 2003 to 2007 testing the downward
trendline from the 20-year super-cycle. The super-trend will
hold if the double top (2006 to 2007) is completed by a fall
below 4.40%. Otherwise, a rise above 5.25% would signal that
the (super cycle) down-trend has ended. It is far too early to
call the start of a new up-trend in the super cycle.
The yield differential (10-year minus 13-week treasury yields)
remains close to zero - a negative sign for the economy.
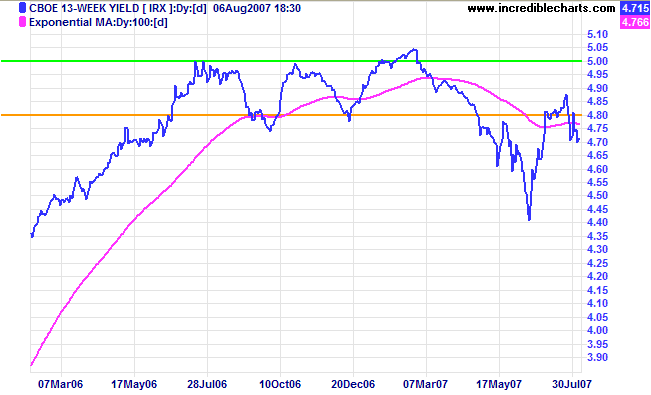
Short-term (13-week) treasury yields continue to soften, reflecting the flow out of equities.
Stock Markets
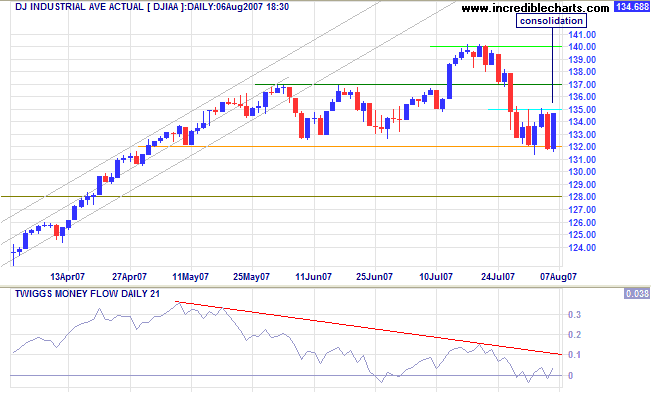
The Dow Jones Industrial Average is consolidating between 13200 and 13500. Sharp swings and high volume signal indecision - the opposite of a dull market offering safe entry at the end of the reaction. A fall below 13200 would signal a test of support at 12800. I would be cautious of a rise above 13500 because of the volatility.
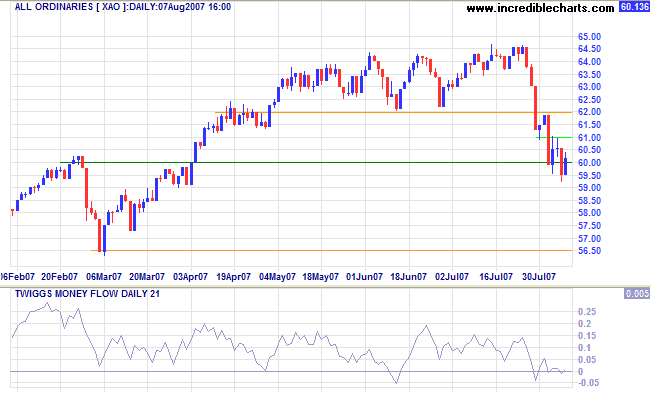
The Australian All Ordinaries rallied strongly after the up-swing in the US, but ended with a weak close as further sellers entered the market. Volume is low, which is a good sign, but we need further reassurance - like one or two weeks of consolidation. Twiggs Money Flow whipsawing around the zero line signals indecision.
Wright Model
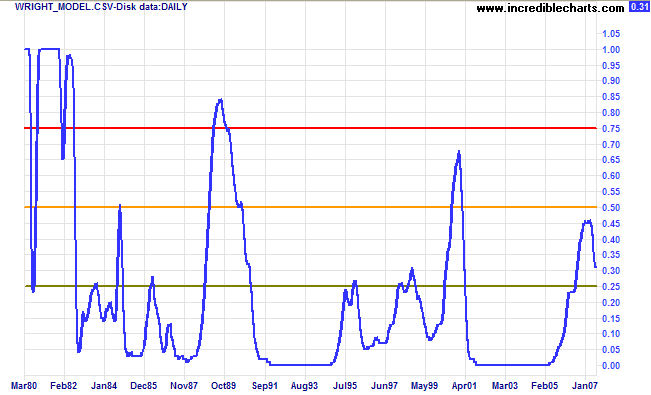
Probability of recession in the next four quarters remains steady at 31 per cent according to the Wright Model.
There is the plain fool, who does the wrong thing at all times
everywhere, but there is the Wall Street fool, who thinks he
must trade all the time. No man can always have adequate
reasons for buying or selling stocks daily - or sufficient
knowledge to make his play an intelligent play.
~ Jesse Livermore in Reminiscences of a Stock Operator by Edwin Lefevre.
To understand my approach, please read Technical Analysis & Predictions in About The Trading Diary.

Author: Colin Twiggs is a former investment banker with almost 40 years of experience in financial markets. He co-founded Incredible Charts and writes the popular Trading Diary and Patient Investor newsletters.
Using a top-down approach, Colin identifies key macro trends in the global economy before evaluating selected opportunities using a combination of fundamental and technical analysis.
Focusing on interest rates and financial market liquidity as primary drivers of the economic cycle, he warned of the 2008/2009 and 2020 bear markets well ahead of actual events.
He founded PVT Capital (AFSL No. 546090) in May 2023, which offers investment strategy and advice to wholesale clients.
