Low CPI Rise Eases Fears
By Colin Twiggs
June 16, 2007 4:00 a.m. EST (6:00 p.m. AEST)
These extracts from my trading diary are for educational purposes and should not be interpreted as investment advice. Full terms and conditions can be found at Terms of Use.
USA: Dow, Nasdaq and S&P500
Core CPI (excluding food & energy) rose just 0.1% in May, compared to 0.2% in April, easing concerns about further rate rises. Equity markets are recovering.
The Dow Jones Industrial Average returned to the upper
border of the trend channel while
Twiggs Money Flow displays a bearish divergence, increasing
the risk of another secondary correction.
Channel lines on the chart below are not symmetrical: I have
dragged the top channel line closer to the linear regression
line because in this case data is not evenly distributed around
the LR line.
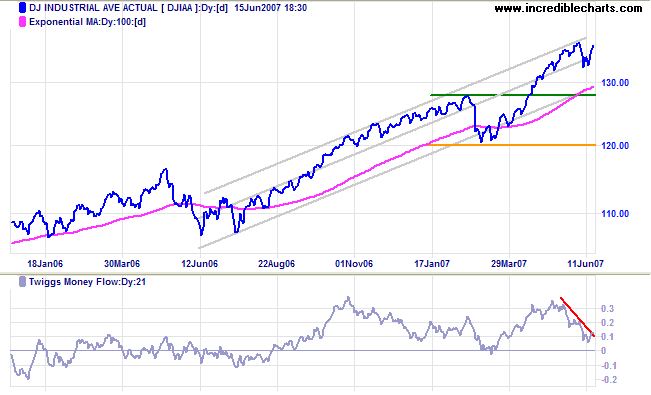
Long Term: The primary up-trend continues.
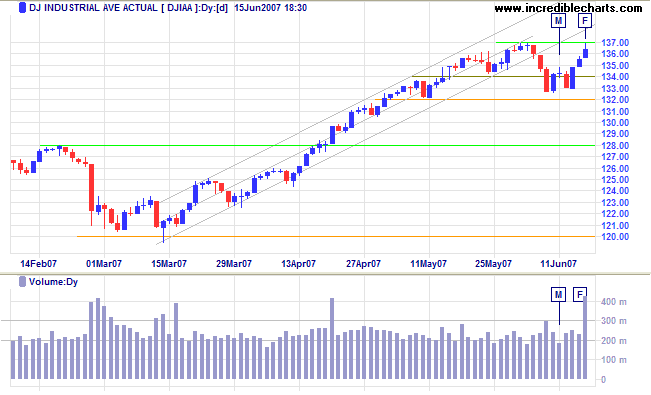
Short Term: Tuesday's retracement respected support at last week's low, evolving into a sharp rally to test resistance at the previous high of 13700. Friday's weak close indicates some profit taking. The volume spike is caused by triple-witching hour: when stock options and many index futures expire - on the third Friday in the last month of each quarter. Narrow consolidation or a short dip would be a bullish sign (as would breakout above 13700), while a close below Friday's low would suggest another test of 13300.
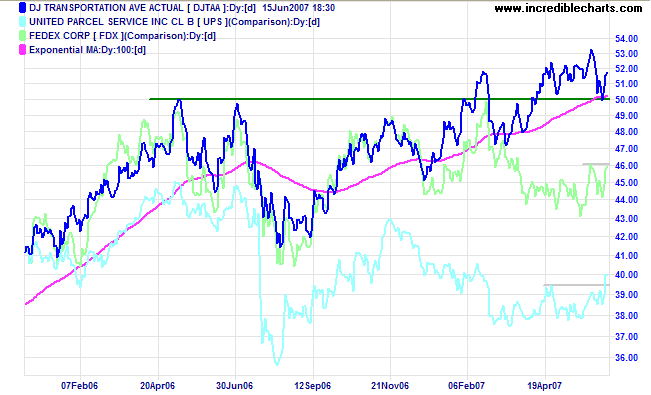
The Dow Jones Transportation Average respected support at 5000 - a bullish sign. UPS shows a bullish upward breakout and Fedex appears set to follow, reinforcing the index signal.
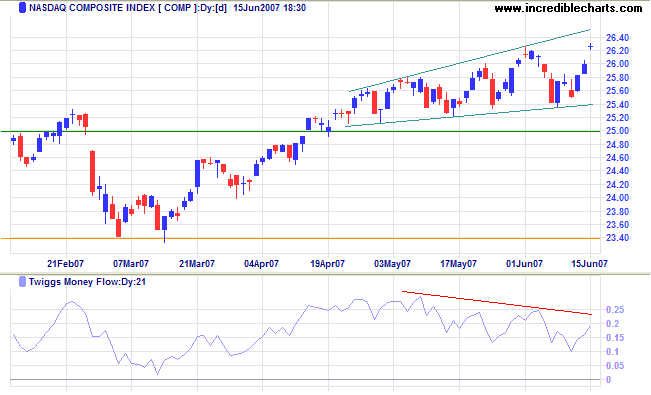
There are two patterns of interest on the Nasdaq
Composite: (i) the ascending broadening wedge warns of a
reversal; and (ii) although the
doji star displays a considerable upward gap, the formation
signals indecision and a fall below 2590 would signal reversal.
A failed up-swing (partial rise) within the ascending wedge
would be a strong bear signal.
Long Term: The primary trend remains upwards, with
support at 2500 (from 2525) and 2340.
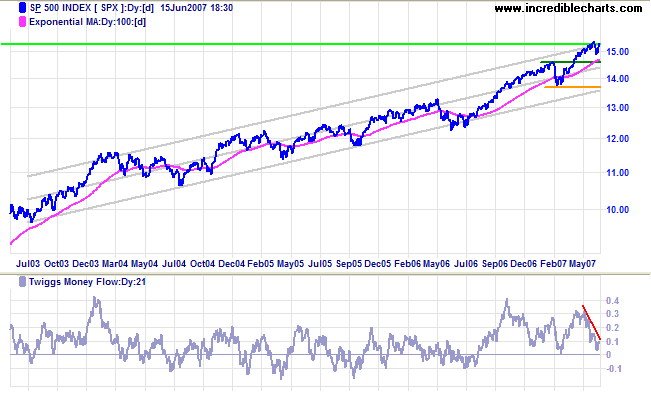
The S&P 500 bearish divergence on
Twiggs Money Flow (21-day) indicates continued
profit-taking. Reversal below Friday's low of 1490 would warn
of a secondary correction. A rise above 1540 would be a strong
bull signal.
Long Term: The primary trend remains up, with support
levels at 1460 and 1375.
LSE: United Kingdom
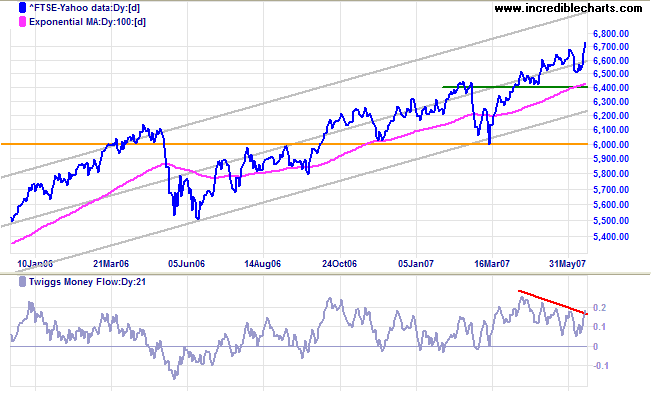
The FTSE 100 broke through resistance and is headed for
a test of the upper trend channel. Reversal below 6500 is not
expected and would signal trend weakness.
Long Term: The primary up-trend continues.
Japan: Nikkei
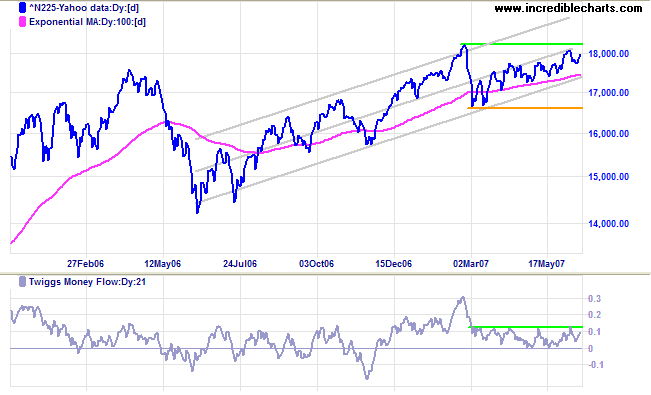
The Nikkei 225 is headed for a test of resistance at the
February 2007 high of 18215. A
Twiggs Money Flow breakout above the last 3 months' highs
would signal increasing accumulation.
Long Term: The primary trend remains up, with primary
support at 16600.
China: Hang Seng
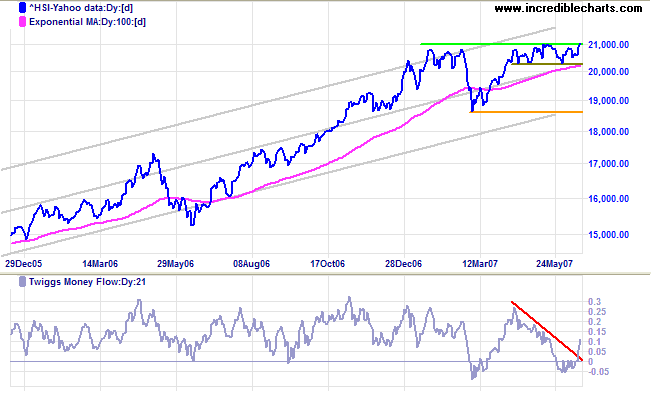
The Hang Seng index is testing resistance at 21000, while Twiggs Money Flow rising steeply signals strong accumulation. Expect a breakout above 21000 to test the upper trend channel. The calculated target would be 23300 (21000+[21000-18700]). Reversal below 20300 is not expected and would warn of a secondary correction.
ASX: Australia
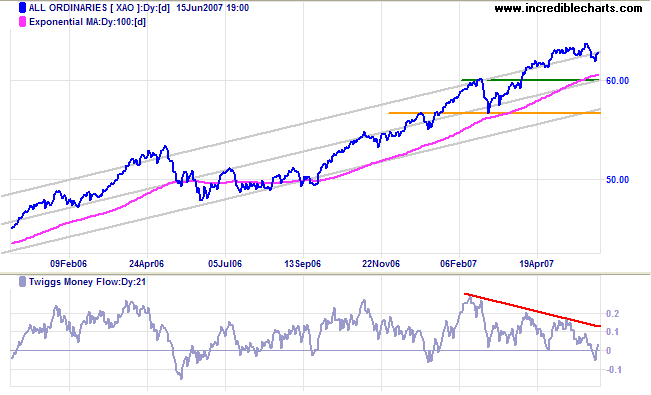
The All Ordinaries displays a broadening top formation
at the upper border of the trend channel, while
Twiggs Money Flow (21-day) shows a large bearish
divergence, warning of profit-taking. Downward breakout would
test the first line of primary support at 6000 and possibly the
second at 5650. Upward breakout is not as likely - and would
warn that the trend may be accelerating into a blow-off.
Long Term: The primary up-trend continues.
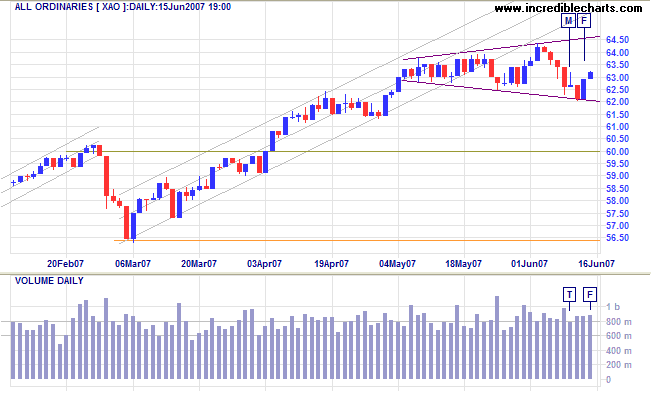
Short Term: Tuesday's decline penetrated last Friday's low, but respected the lower border of the broadening top formation. Watch for a failed swing (partial rise or decline) which would signal future direction ahead of a breakout.
If everybody is thinking alike,
then somebody isn't thinking.
~ General George S. Patton Jnr.
To understand my approach, please read Technical Analysis & Predictions in About The Trading Diary.

Author: Colin Twiggs is a former investment banker with almost 40 years of experience in financial markets. He co-founded Incredible Charts and writes the popular Trading Diary and Patient Investor newsletters.
Using a top-down approach, Colin identifies key macro trends in the global economy before evaluating selected opportunities using a combination of fundamental and technical analysis.
Focusing on interest rates and financial market liquidity as primary drivers of the economic cycle, he warned of the 2008/2009 and 2020 bear markets well ahead of actual events.
He founded PVT Capital (AFSL No. 546090) in May 2023, which offers investment strategy and advice to wholesale clients.
