Gold, Oil, Currencies & Interest Rates
By Colin Twiggs
June 12, 2007 3:30 a.m. EST (5:30 p.m. AEST)
These extracts from my trading diary are for educational purposes and should not be interpreted as investment advice. Full terms and conditions can be found at Terms of Use.
Gold
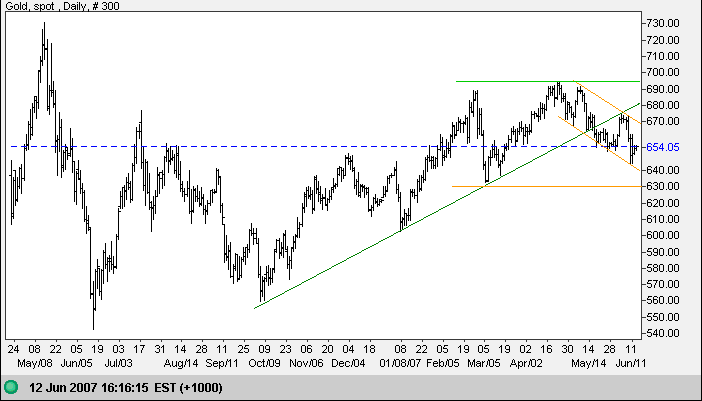
Spot gold continues its secondary correction after breaking
below support at $650. Expect a test of primary support at
$630.
In the longer term, the primary trend remains up and a rise
above $695 would signal continuation of the up-trend, while a
fall below $630 would signal that the primary trend has
reversed. Strong crude prices normally support demand for gold,
but this is being offset by a strong dollar.
Source: Netdania
Crude Oil
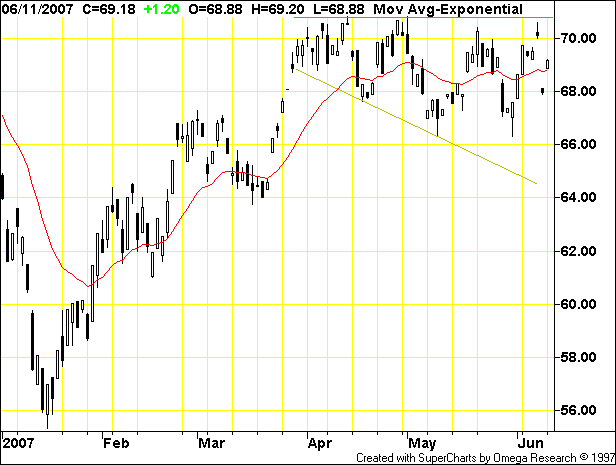
December Light Crude continues in a right-angled descending broadening formation; last week's failed swing to the lower border signals that an upward breakout is likely.
Currencies
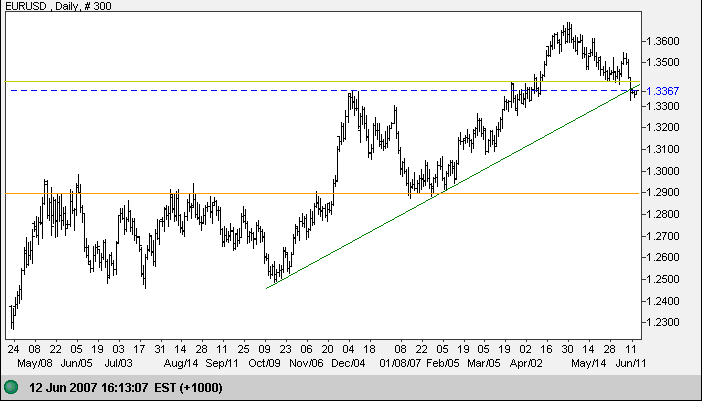
Recovery of the euro failed, with the currency breaking below the first line of primary support at $1.34 and the long-term trendline - signaling trend weakness. Narrow consolidation over the last three days indicates uncertainty: a downward break would signal a test of primary support at $1.29, while upward breakout would warn of a possible bear trap.
Source: Netdania
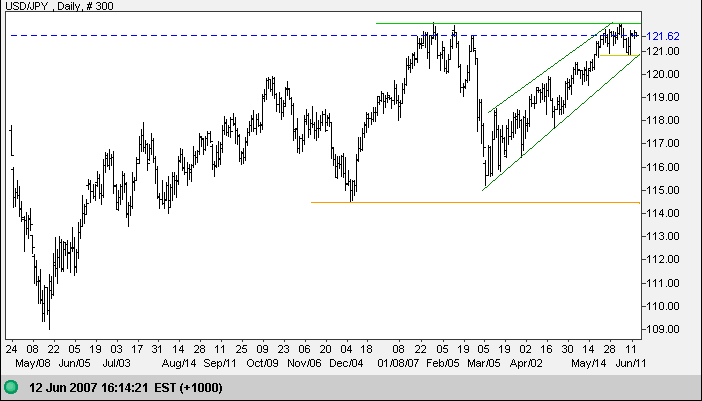
The dollar is in a bullish narrow consolidation below 122 against the yen. An upward breakout is more likely, signaling continuation of the primary advance, while downward breakout would test primary support at 115.00/114.50.
Source: Netdania
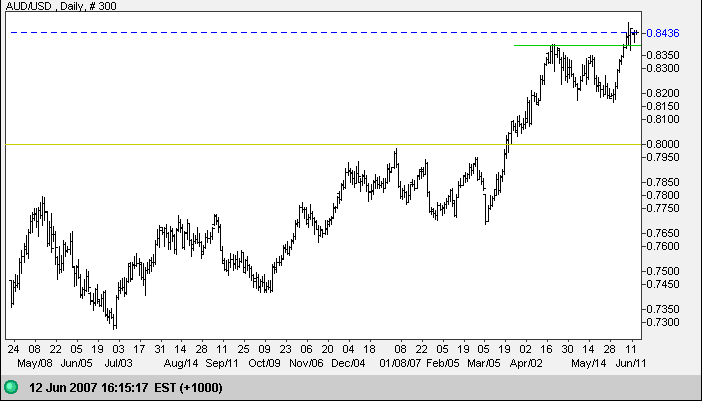
The Australian dollar is consolidating after recovering above 0.8400 - another bullish sign after failure to test support at 0.8000 indicated a strong up-trend.
Source: Netdania
Treasury Yields
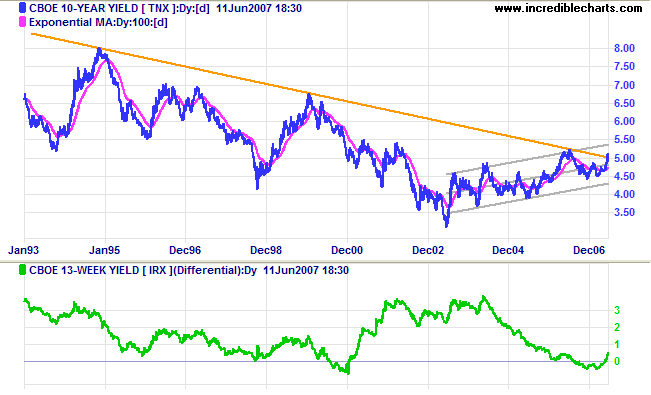
Ten-year treasury yield breakout above the long-term downward
trendline suggest that the super-cycle bear trend may be
over - reinforced if there is a rise above the 2006 high of
5.25%. Higher long-term yields tend to raise the required rate
of return for equity investments and reduce Price-Earnings (PE)
ratios, weighing on the market.
The rising yield differential (10-year minus 13-week treasury
yields) signals a more positive outlook for the economy.
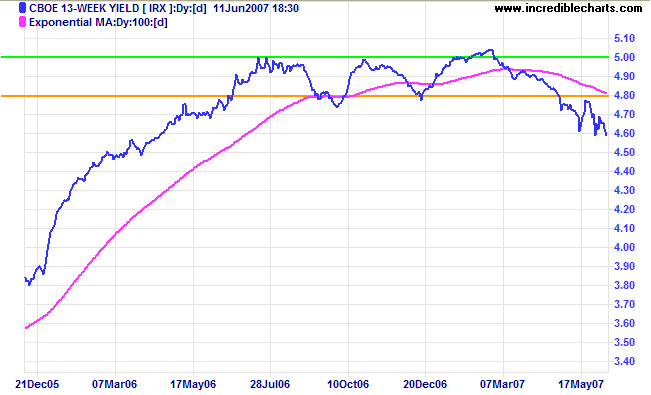
Short-term (13-week) treasury yields are falling while the effective Federal Funds Rate is constant. The flow of funds from long-term to short-term treasuries means that the market anticipates further rates rises.
Stock Markets
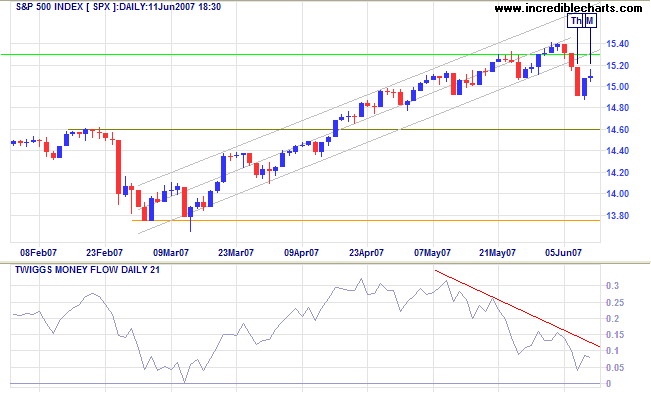
The S&P 500 attempted rally has encountered resistance, signaled by the doji candlestick at [M]. A fall below Friday's low at 1490 would warn of a secondary correction, while a close above Monday's high would signal that buyers have regained control. Bearish divergence on Twiggs Money Flow favors a downside breakout.
Wright Model
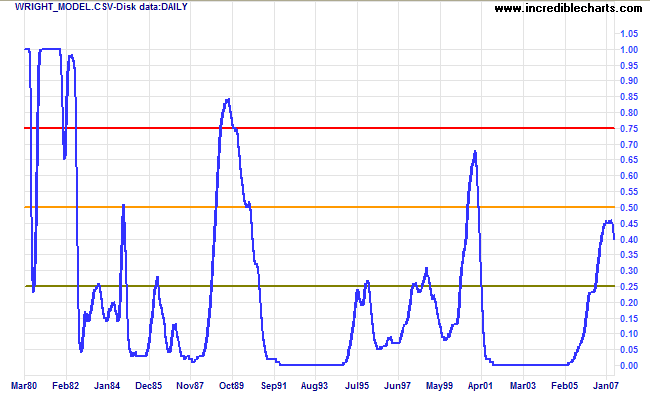
Probability of recession in the next four quarters continues to fall, reaching 40 per cent according to the Wright Model.
Be like a postage stamp.
Stick to one thing until you get there.
~ Josh Billings
To understand my approach, please read Technical Analysis & Predictions in About The Trading Diary.

Author: Colin Twiggs is a former investment banker with almost 40 years of experience in financial markets. He co-founded Incredible Charts and writes the popular Trading Diary and Patient Investor newsletters.
Using a top-down approach, Colin identifies key macro trends in the global economy before evaluating selected opportunities using a combination of fundamental and technical analysis.
Focusing on interest rates and financial market liquidity as primary drivers of the economic cycle, he warned of the 2008/2009 and 2020 bear markets well ahead of actual events.
He founded PVT Capital (AFSL No. 546090) in May 2023, which offers investment strategy and advice to wholesale clients.
