Rising Treasury Yields
By Colin Twiggs
June 9, 2007 1:00 a.m. EST (3:00 p.m. AEST)
These extracts from my trading diary are for educational purposes and should not be interpreted as investment advice. Full terms and conditions can be found at Terms of Use.
USA: Dow, Nasdaq and S&P500
Rising 10- and 30-year treasury yields signal a weakening of the long-term bear market and sparked a brief equity sell-off. The next week should tell whether the reaction is quickly mopped up by buyers or evolves into a secondary correction.
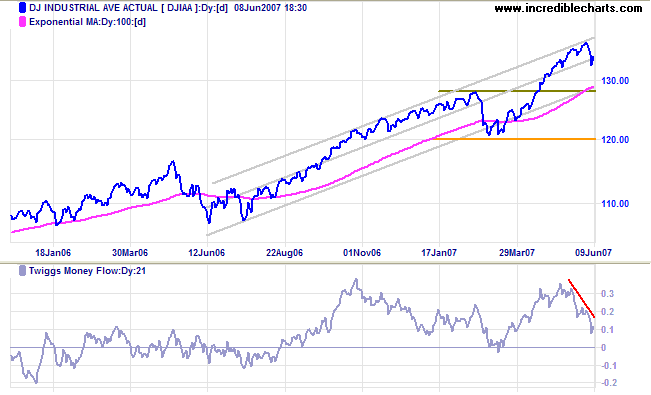
The Dow Jones Industrial Average retreated from the
upper border of the trend channel, warning of a secondary
correction that would test primary support at 12800 and
possibly 12000. A bearish divergence on
Twiggs Money Flow signals distribution.
Channel lines on the chart below are not symmetrical: I have
dragged the top channel line closer to the linear regression
line because in this case data is not evenly distributed around
the LR line.
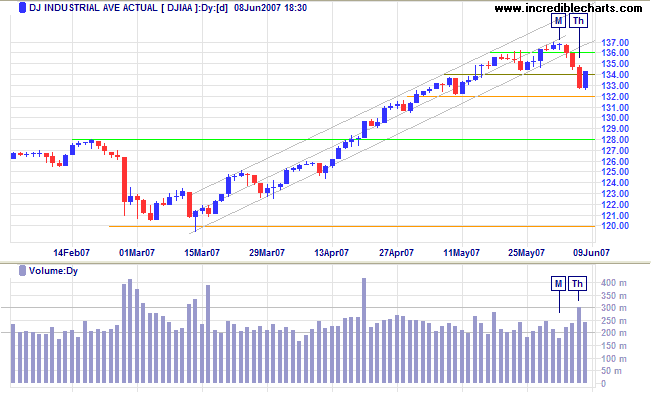
Long Term: The primary up-trend continues.
Short Term: Low volume on Monday signaled that the up-trend was losing momentum. A sharp three day fall followed, ending when strong volume [Th] signaled that buyers had re-entered the market. The break below the trend channel indicates that the primary advance is weakening and a rally that fails to test 13700 would warn of a secondary correction - confirmed if the index reverses below Friday's low of 13250.
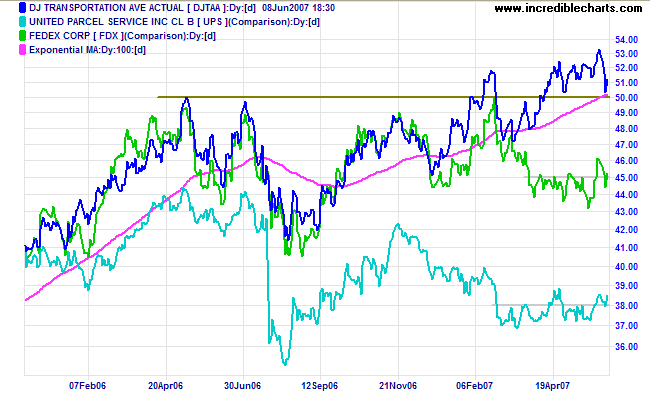
The Dow Jones Transportation Average is testing support at 5000. Respect of support would be a bullish sign, while failure would signal further consolidation (uncertainty). Fedex and UPS both show bullish upward breakouts.
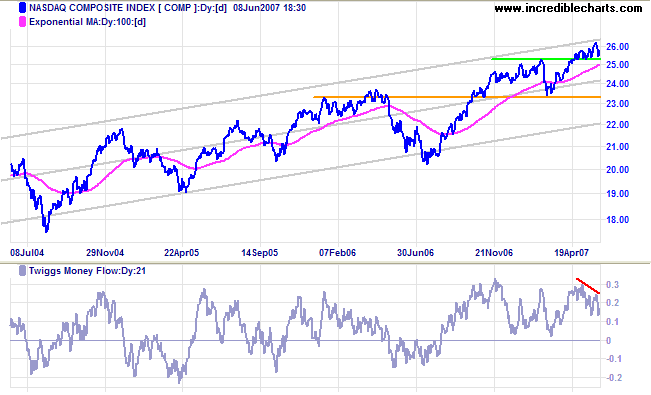
The Nasdaq Composite is consolidating near the upper
trend channel on the 3 year chart and bearish divergence on
Twiggs Money Flow (21-day) warns of distribution. A fall
below 2525 would be bearish.
Long Term: The primary trend remains upwards, with
support at 2525 and 2340.
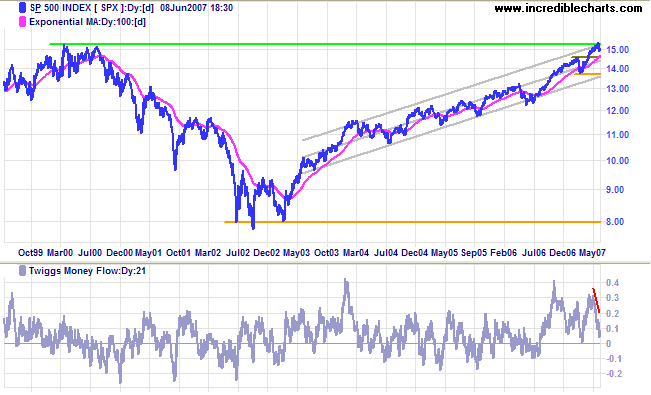
The S&P 500 retreated below the 2000 high of 1530,
while a bearish divergence on
Twiggs Money Flow (21-day) warns of distribution. Reversal
below Friday's low of 1490 would warn of a secondary
correction.
Long Term: The primary trend remains up, with support
levels at 1460 and 1375.
LSE: United Kingdom
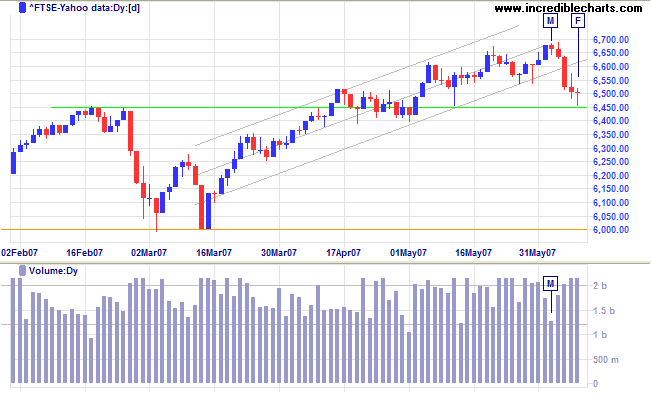
The FTSE 100 broke below the trend channel - signaling
trend weakness - after a failed breakout above resistance at
6650. Strong volume and weak closes in the latter part of the
week indicate that buyers have re-entered the market. A fall
below the first line of primary support at 6450 would warn of a
secondary correction, possibly testing primary support at
6000.
Long Term: The primary up-trend continues.
Japan: Nikkei
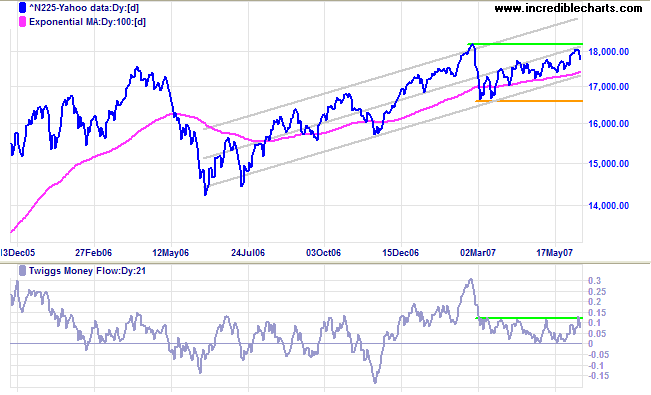
The Nikkei 225 continues to edge upwards towards
resistance at the February 2007 high. A rise above 18215 would
signal a test of the upper border of the trend channel, while
downward breakout from the trend channel would indicate that
the primary trend is weakening.
Twiggs Money Flow continues to respect the zero line,
signaling accumulation.
Long Term: The primary trend remains up, with primary
support at 16600.
China: Hang Seng
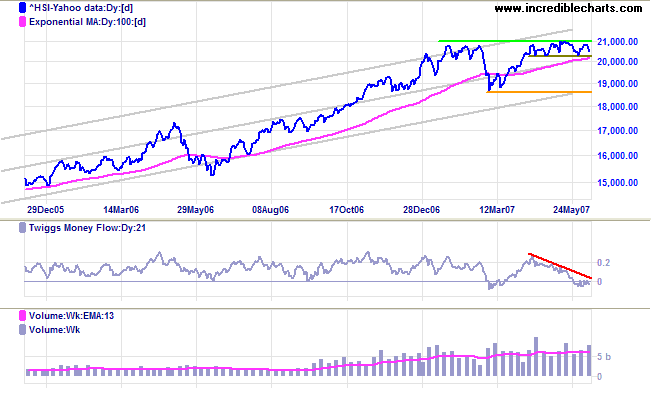
Volumes on the Hang Seng index have trebled over the last 9 months, indicating that the market is overheating. The index continues to consolidate in a narrow band between 21000 and 20300, normally a bullish sign in an up-trend, but Twiggs Money Flow signals strong distribution. The two scenarios appear equally likely: a fall below 20300 would warn of a secondary correction testing primary support at 18700, while a rise above 21000 would signal that the primary advance continues.
ASX: Australia
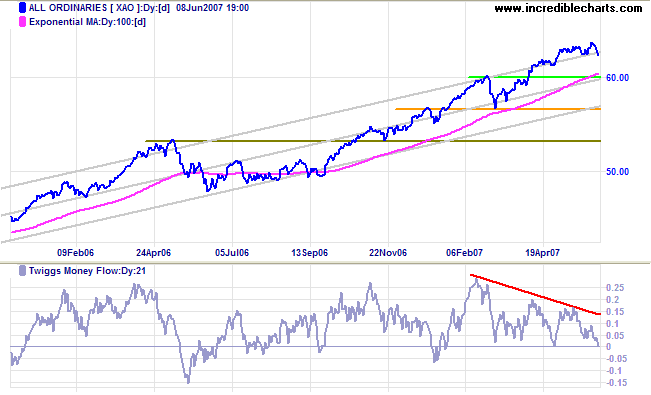
The All Ordinaries continues to consolidate at the upper
border of the trend channel. An upward breakout is less likely
- because of the position on the trend channel and
Twiggs Money Flow (21-day) testing zero after a large
bearish divergence - but would warn of an accelerating up-trend
and possible blow-off. Downward breakout would test the first
line of primary support at 6000 and possibly the second at
5650.
Long Term: The primary up-trend continues.
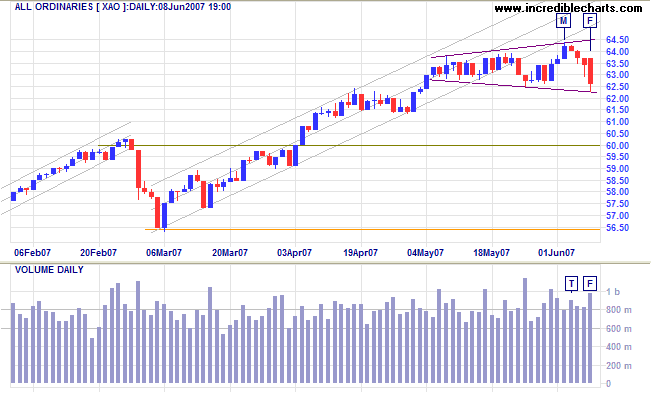
Short Term: Monday's failed breakout encountered resistance above 6400 - signaled by strong volume at [T] - before retracing to test support on Friday. Weak closes and strong volume at [F] reveal that buyers remain committed. The rectangle pattern has morphed into a broadening top formation; future direction will be signaled by a failed swing (partial rise or decline) or an actual breakout.
The financial markets generally are unpredictable. So that one
has to have different scenarios... The idea that you can
actually predict what's going to happen contradicts my way of
looking at the market.
~ George Soros
To understand my approach, please read Technical Analysis & Predictions in About The Trading Diary.

Author: Colin Twiggs is a former investment banker with almost 40 years of experience in financial markets. He co-founded Incredible Charts and writes the popular Trading Diary and Patient Investor newsletters.
Using a top-down approach, Colin identifies key macro trends in the global economy before evaluating selected opportunities using a combination of fundamental and technical analysis.
Focusing on interest rates and financial market liquidity as primary drivers of the economic cycle, he warned of the 2008/2009 and 2020 bear markets well ahead of actual events.
He founded PVT Capital (AFSL No. 546090) in May 2023, which offers investment strategy and advice to wholesale clients.
