Bulls Ignore China
By Colin Twiggs
June 2, 2007 2:00 a.m. EST (4:00 p.m. AEST)
These extracts from my trading diary are for educational purposes and should not be interpreted as investment advice. Full terms and conditions can be found at Terms of Use.
USA: Dow, Nasdaq and S&P500
Markets have so far shown little ill-effect from the uncertainty in China, with a number of indices displaying bullish breakouts.
The Dow Jones Industrial Average broke through the upper
border of the trend channel, while
Twiggs Money Flow warns of strong distribution (more than
likely a resulting from volatility in China) over the past
week. The index has also reached its target of 13600
(12800+[12800-12000]) and a secondary correction is expected
soon.
Channel lines on the chart below are not symmetrical: I have
dragged the top channel line closer to the linear regression
line because in this case data is not evenly distributed around
the LR line.
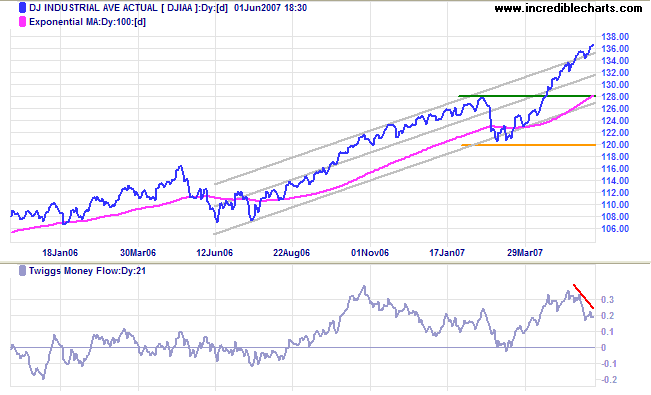
Long Term: The primary up-trend continues, with primary support at 12800 and 12000.
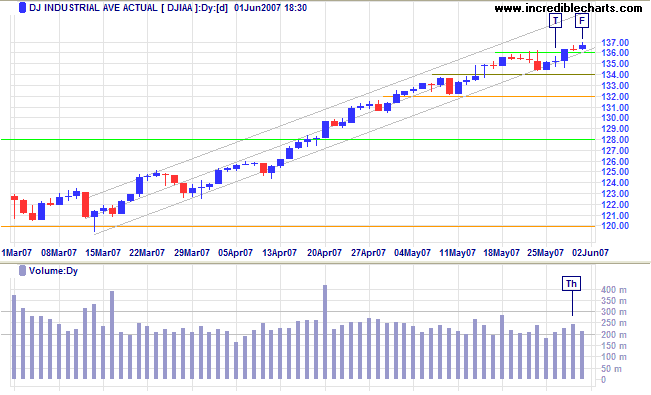
Short Term: Despite some resistance, signaled by higher volume on Thursday, the Dow broke above 13600. Declining activity levels indicate that buyers are increasingly wary.
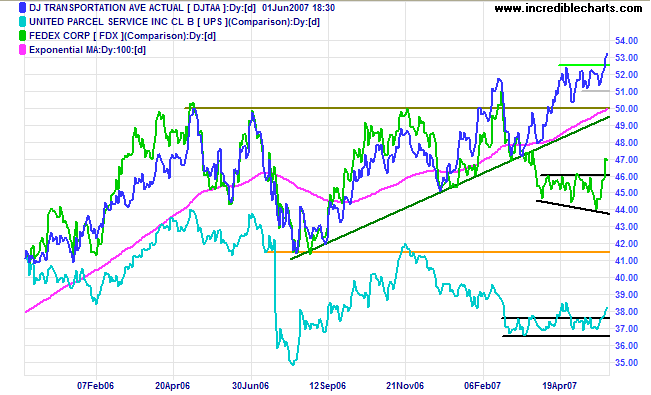
The Dow Jones Transportation Average shows a bullish breakout above 5250 - which should test 5500. Fedex broke out above a right-angled broadening formation and is likely to test its 2006/2007 highs. UPS also shows bullish signs, with a breakout above the recent narrow consolidation.
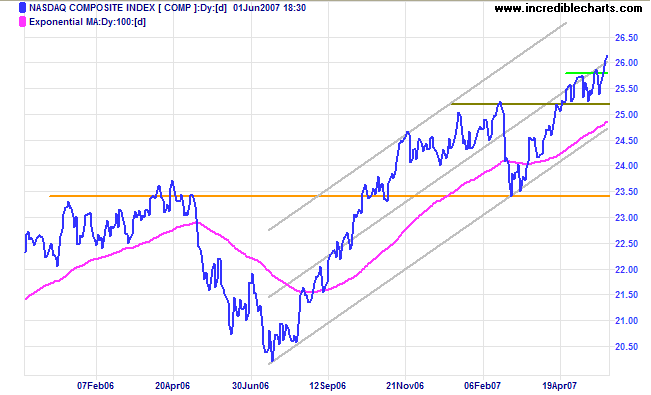
The Nasdaq Composite broke upwards from its recent
narrow consolidation and is likely to test the upper trend
channel. While not at all expected, reversal below 2525 would
warn of another secondary correction.
Twiggs Money Flow (21-day) continues to respect the zero
line, signaling long-term accumulation.
Long Term: The primary trend is up, with support at 2350
and 2000.
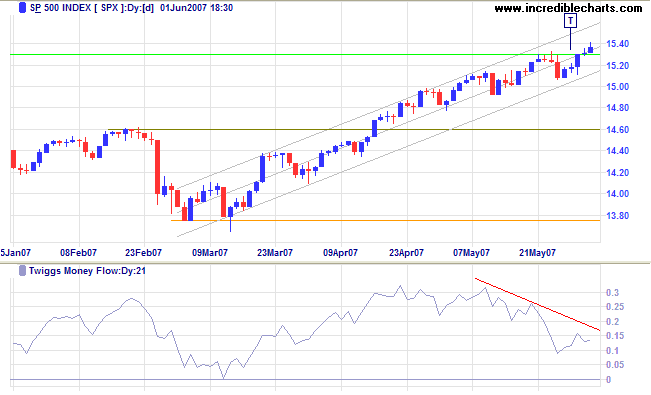
The S&P 500 broke through to a new all-time high
above 1530, but closes are weak and
Twiggs Money Flow (21-day) falling sharply warns of
profit-taking. Reversal below 1530 would indicate weakness,
strengthened if there is a break below the trend channel; while
a fall below 1500 would warn of a secondary correction.
Long Term: The primary trend is up, with support levels
at 1460 and 1375.
LSE: United Kingdom
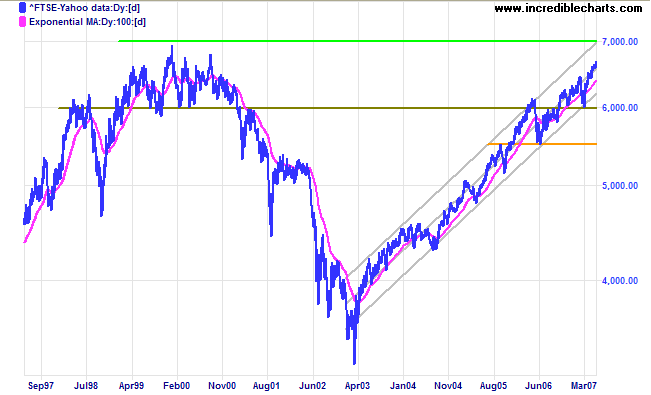
The FTSE 100 recovered above 6650, and appears set for a
test of the upper trend channel and the all-time high of 7000.
Twiggs Money Flow recovered rapidly after a sharp fall. Though
unlikely, reversal below 6550 would warn of a secondary
correction.
Long Term: The primary up-trend continues, with primary
support at 6450 and 6000.
Japan: Nikkei
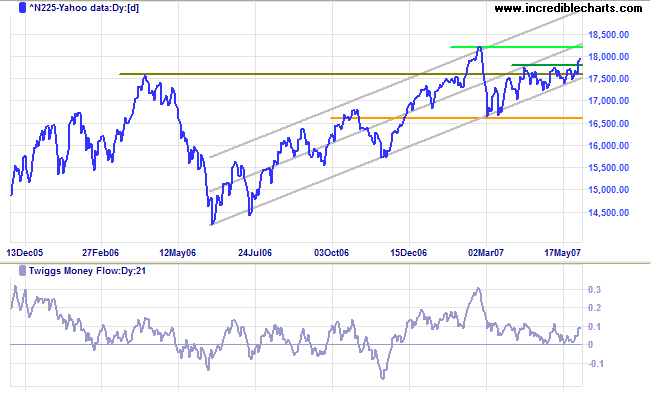
The Nikkei 225 broke above the recent bullish ascending
triangle and is headed for the February high. If that is
overcome expect a test of the upper border of the trend
channel. Though unlikely, a downward breakout below the lower
channel border would warn of a test of primary support at
16600.
Twiggs Money Flow continues to respect the zero line,
signaling accumulation.
Long Term: The primary trend remains up.
China: Hang Seng & Shanghai indexes
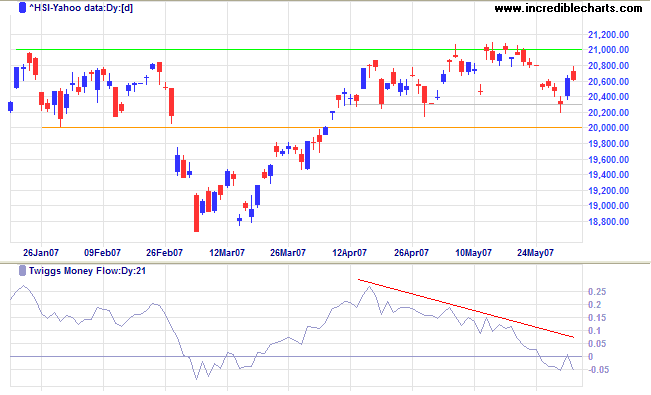
The Hang Seng found support at 20300, with a long tail
on Wednesday.
Twiggs Money Flow is bearish, however, having respected the
zero line from below. A fall below 20000 would warn of a
secondary correction, while a rise above 21000 would signal
resumption of the up-trend.
Long Term: The primary advance continues.
ASX: Australia
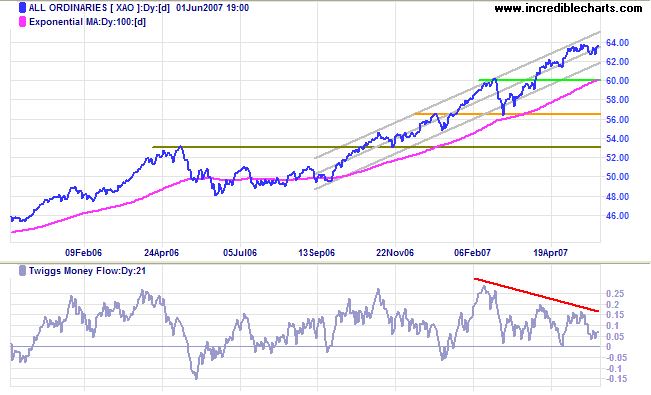
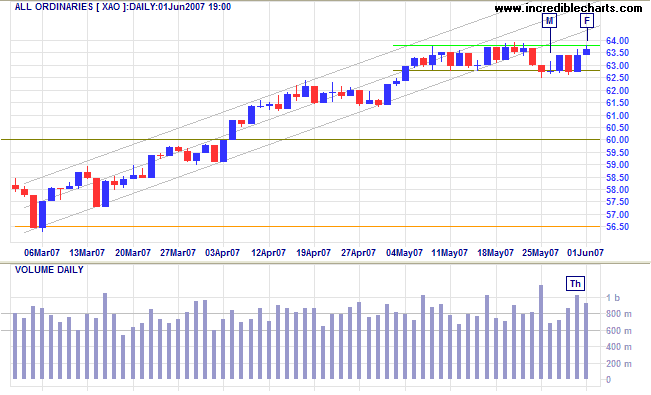
Having reached its target of 6350 (6000+[6000-5650]), the
All Ordinaries consolidated in a narrow band for several
weeks. Normally a continuation signal, the current rectangle
has roughly an even chance of breaking out in either direction.
Twiggs Money Flow (21-day) displays a large bearish
divergence, warning of significant profit-taking, with stocks
changing from strong hands to weak hands.
Long Term: The primary up-trend continues, with support
at 6000 and 5650.
Short Term: Fluctuating volumes reveal committed buyers and sellers as the index ranges from one border of the rectangle to the other. Tom Bulkowski has done some excellent research on rectangle patterns and found a low 2% failure rate for upside breakouts and an even lower rate for downward breakouts. Premature breakouts (or false breaks as they are often called), when they do occur, often warn of a genuine breakout in the opposite direction.
It’s the unconquerable soul of man, not the nature of the
weapon he uses, that insures victory.
~ General George S Patton Jr.
To understand my approach, please read Technical Analysis & Predictions in About The Trading Diary.

Author: Colin Twiggs is a former investment banker with almost 40 years of experience in financial markets. He co-founded Incredible Charts and writes the popular Trading Diary and Patient Investor newsletters.
Using a top-down approach, Colin identifies key macro trends in the global economy before evaluating selected opportunities using a combination of fundamental and technical analysis.
Focusing on interest rates and financial market liquidity as primary drivers of the economic cycle, he warned of the 2008/2009 and 2020 bear markets well ahead of actual events.
He founded PVT Capital (AFSL No. 546090) in May 2023, which offers investment strategy and advice to wholesale clients.
