Dow Trend Channel Breakout
By Colin Twiggs
May 19, 2007 2:00 a.m. EST (4:00 p.m. AEST)
These extracts from my trading diary are for educational purposes and should not be interpreted as investment advice. Full terms and conditions can be found at Terms of Use.
USA: Dow, Nasdaq and S&P500
The Dow Jones Industrial Average broke through the upper
border of the trend channel, accompanied by rising
Twiggs Money Flow. Accelerating up-trends make big gains
but normally end with a sharp reversal; so it is important to
protect profits. Reversal below the upper channel line would
signal that the trend is weakening; and a fall below 13200
would warn of a secondary correction. Respect of the upper
channel line, on the other hand, would indicate that the trend
has plenty of gas in the tank.
Channel lines on the chart below are not symmetrical: I have
dragged the top channel line closer to the linear regression
line because in this case data is not evenly distributed around
the LR line.
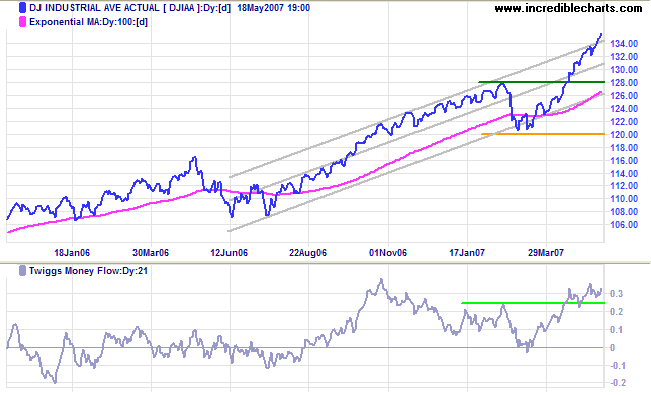
Long Term: The primary up-trend continues, with the first line of support at 12800 and primary support at 12000.
|
A readers question, as to why trend channels drawn on the short-term price chart did not coincide with the latest secondary correction and primary advance, prompted me to review my recent analysis of the primary trend. Robert Rhea (The Dow Theory, 1932) defines a secondary reaction as "an important decline... usually lasting from three weeks to as many months, during which interval the price movement generally retraces from 33 per cent to 66 per cent of the primary price change since the termination of the last preceding secondary reaction." The key words are: an important decline. The duration and percentage retracement are merely guidelines. Rhea himself records secondary reactions as short as 7 days; and others where retracement is as low as 20 per cent. The recent February/March reaction endured less than 3 weeks and is borderline one-third retracement. Nevertheless I believe that it qualifies as an important decline and should be considered a secondary reaction. Primary support levels have been revised accordingly. |
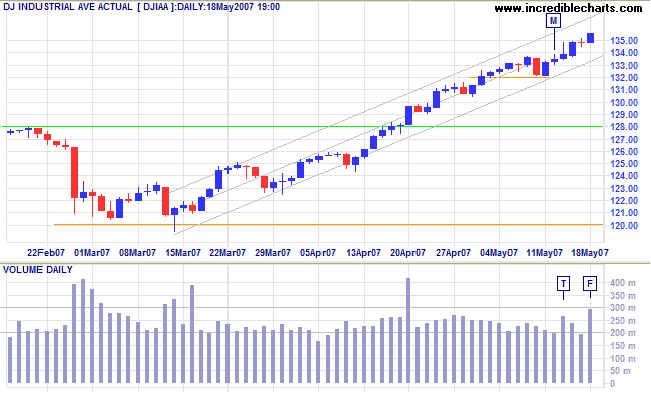
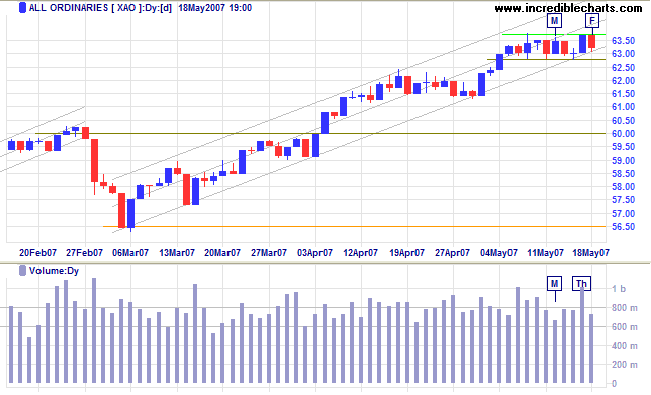
Short Term: Short retracements and respect of the lower trend channel line (on the short-term chart) both signal trend strength. Large volume [F] is due to Friday's options expiry. Breakout below the trend channel, though not yet expected, would signal that the trend is weakening.
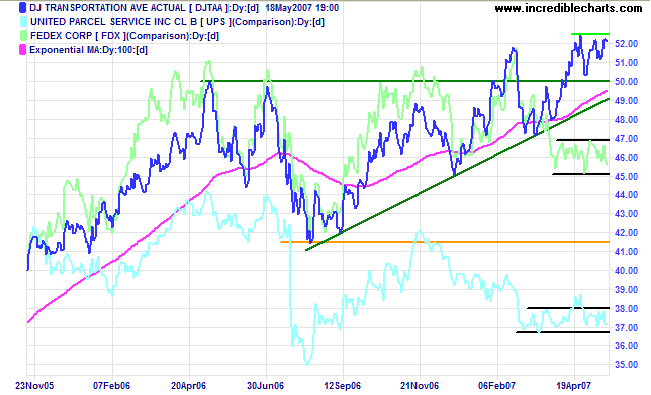
The Dow Jones Transportation Average is consolidating below 5250, a bullish sign, but Fedex and UPS both display bearish consolidations (during a secondary correction) - hinting at an economic slow-down.
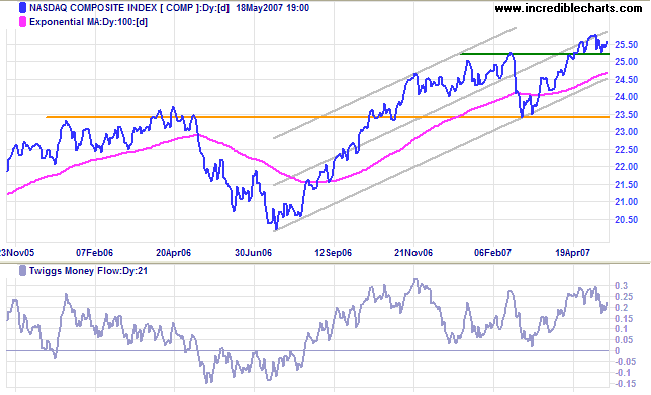
The Nasdaq Composite displays a bullish narrow
consolidation above the first level of primary support at 2525.
An upward breakout would signal a test of the upper trend
channel, while a fall below 2500 would test the lower channel
border and threaten primary support at 2340.
Twiggs Money Flow (21-day) signals long-term accumulation,
having respected the zero line for several months.
Long Term: The primary trend is up.
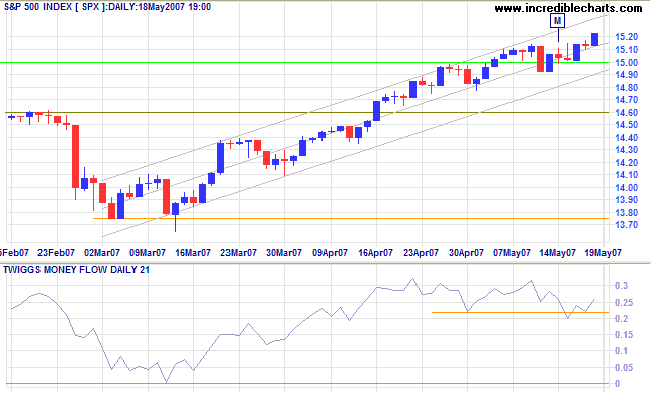
The S&P 500 found support at 1500 on Monday/Tuesday
before resuming the up-trend. Expect a test of the upper
channel border.
Twiggs Money Flow (21-day) signals both long- and
short-term accumulation after recovering above the April 30
low.
Long Term: The primary trend is up, with support levels
at 1460 and 1375.
LSE: United Kingdom
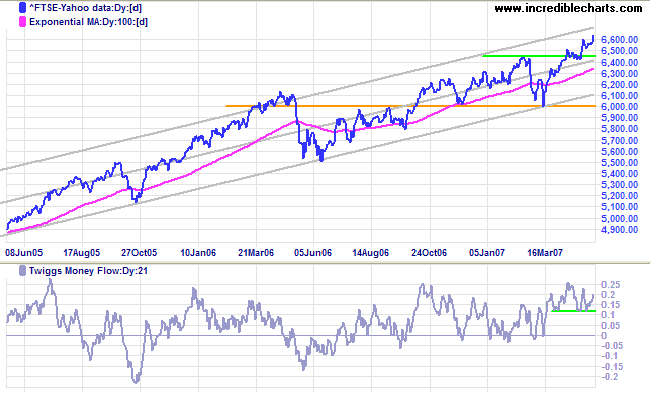
The FTSE 100 is headed for a test of the upper trend
channel after recovering above 6600. Twiggs Money Flow signals
accumulation, holding well above zero.
Long Term: The primary up-trend continues. Reversal
below 6400 is not expected, but would signal a test of primary
support at 6000.
Nikkei: Japan
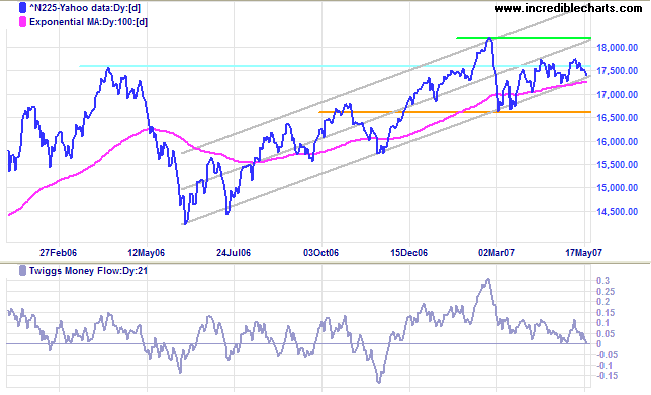
The Nikkei 225 is testing the lower border of the trend
channel; a break below the channel line and 100-day moving
average would warn of a test of primary support at 16600. A
Twiggs Money Flow fall below zero would signal
distribution. Recovery above 17600, on the other hand, would
signal a test of the upper trend channel.
Long Term: The primary trend remains up.
ASX: Australia
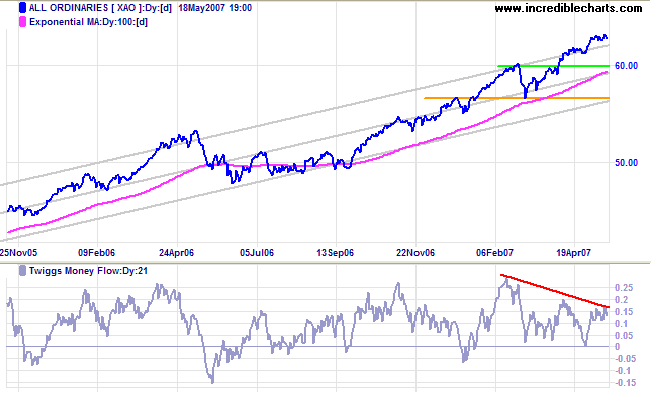
The All Ordinaries is rising above the upper border of
the trend channel, signaling a fast up-trend. The downside is
that fast trends are often followed by sharp reversals; it is
advisable to protect profits. Bearish divergence on
Twiggs Money Flow (21-day) warns of profit-taking.
Long Term: The primary up-trend continues, with support
at 6000 and 5650.
Short Term: The bullish narrow consolidation continues: expect an upward breakout to test the upper channel border. Thursday's exceptional volume is largely attributable to unusual activity in Sigma Pharmaceuticals [SIP], with more than 94 million shares changing hands.
A good plan executed now is better than the perfect plan
tomorrow.
~ General George S Patton Jr.
To understand my approach, please read Technical Analysis & Predictions in About The Trading Diary.

Author: Colin Twiggs is a former investment banker with almost 40 years of experience in financial markets. He co-founded Incredible Charts and writes the popular Trading Diary and Patient Investor newsletters.
Using a top-down approach, Colin identifies key macro trends in the global economy before evaluating selected opportunities using a combination of fundamental and technical analysis.
Focusing on interest rates and financial market liquidity as primary drivers of the economic cycle, he warned of the 2008/2009 and 2020 bear markets well ahead of actual events.
He founded PVT Capital (AFSL No. 546090) in May 2023, which offers investment strategy and advice to wholesale clients.
