Gold, Oil, Currencies & Interest Rates
By Colin Twiggs
May 15, 2007 9:30 p.m. EST (11:30 a.m. AEST)
These extracts from my trading diary are for educational purposes and should not be interpreted as investment advice. Full terms and conditions can be found at Terms of Use.
Gold
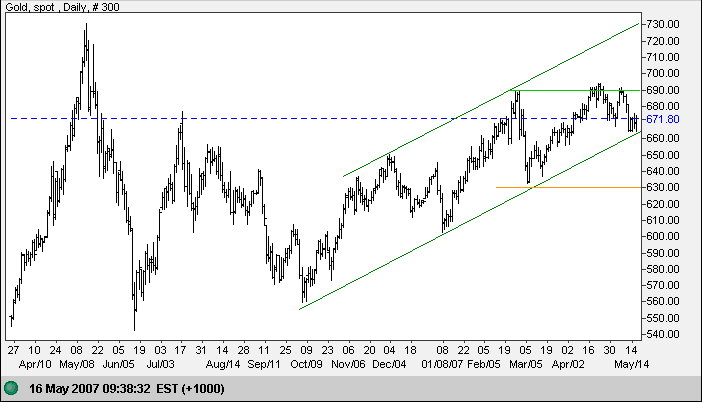
Spot gold formed a narrow consolidation at the lower border of
the trend channel. An upward breakout is favored and would
signal another test of resistance at $690, while a downward
break would warn that the trend is slowing. In the longer term,
a rise above $690 would signal a test of the upper trend
channel; and a fall below support at $630, though not expected,
would signal that the trend has reversed.
Weaker crude prices continue to ease demand for gold.
Source: Netdania
Crude Oil
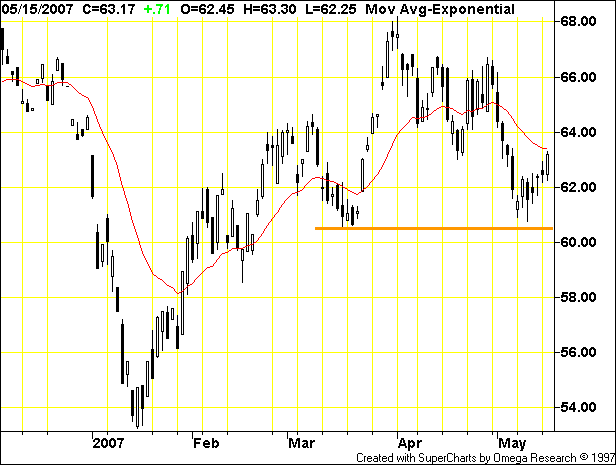
June Light Crude respected support above $60, but will not signal that the April down-trend has reversed until a higher low is followed by a new high. The most likely scenario is a further test of support at the March low, failure of which would warn of a test of primary support at $53.
Currencies
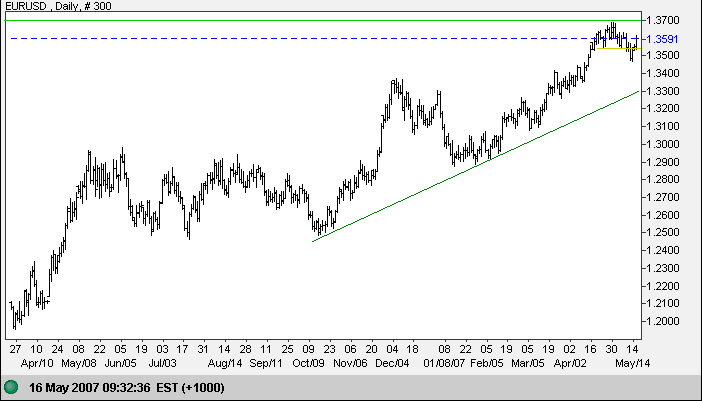
The euro dipped below short-term support at $1.3550, but has since recovered and is headed for another test of resistance at the 2005 high of $1.37. Breakout above $1.37 would be a strong sign for the euro, with a long-term target of $1.57 (1.37 + [ 1.37 - 1.17 ]). Reversal below $1.29, though not expected, would signal that the up-trend has reversed.
Source: Netdania
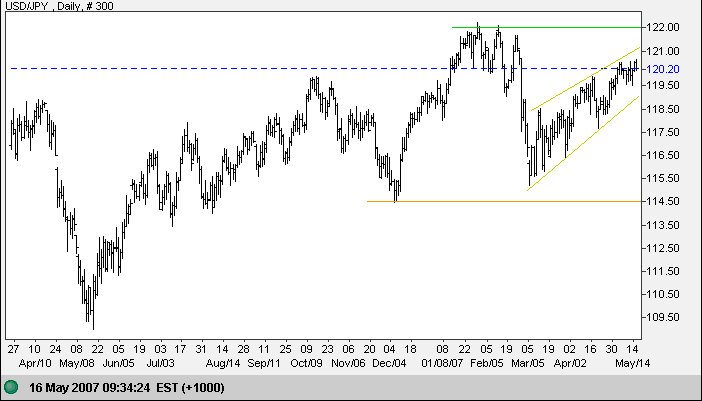
The dollar continues in a bearish rising wedge against the yen. A downward breakout would warn of a rest of support at 114.50; while breakout above the upper border, though not as likely, would signal a test of long-term resistance at 122. In the longer term, failure of support at 114.50 would warn of a major correction; while breakout above 122 would complete a bullish ascending triangle pattern on the weekly chart, with a calculated target of 134 (122 + [122-110]).
Source: Netdania
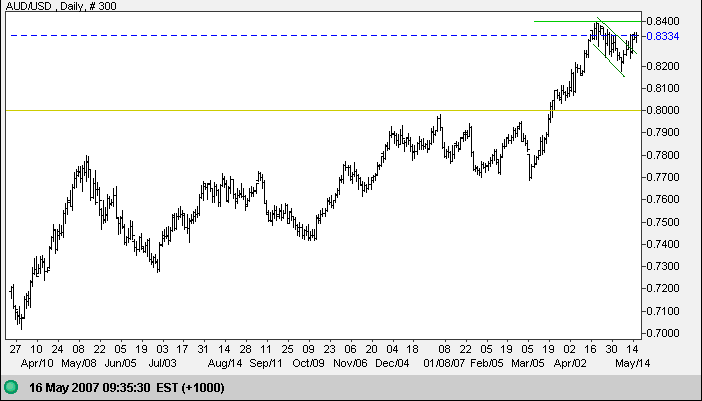
The Australian dollar completed a bullish short-term flag formation with a breakout above the upper border. The target is 0.87 ( 0.83 + [0.84-0.80]), but expect some resistance at 0.84. Reversal below 0.82, though unlikely, would warn of a test of the new support level at 80.
Source: Netdania
Treasury Yields
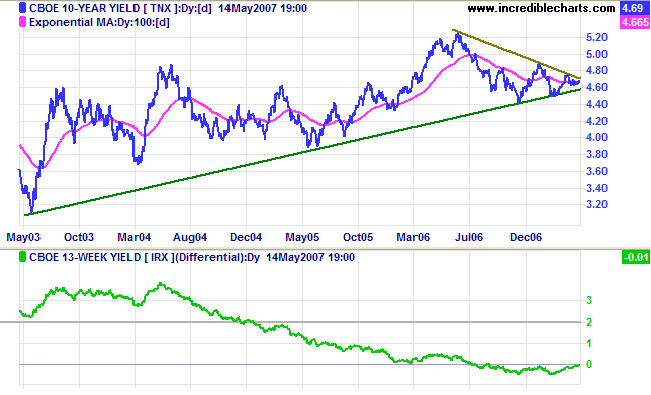
Ten-year treasury yields are consolidating in a narrow band between 4.40% and 4.80%. Breakout from the large symmetrical triangle is not of any great significance as we are in the last third of the pattern. The yield differential (10-year minus 13-week treasury yields) is improving, caused by falling short-term yields.
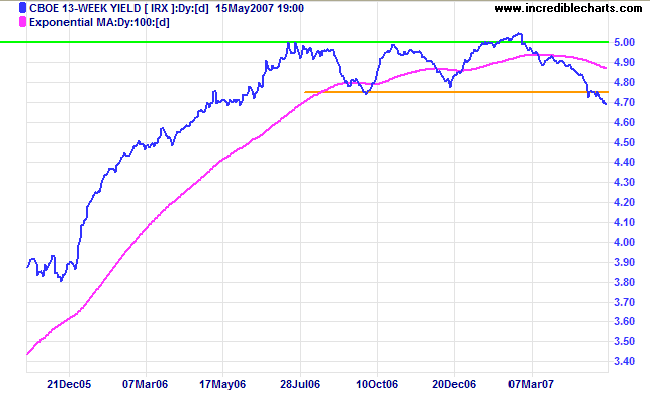
Short-term treasury yields continue to fall, signaling that the Fed is increasing liquidity in the economy. Prospects of further rates rises appear to be minimal and, while a rate cut may still be some way off, chances of softening rates are improving.
Stock Markets
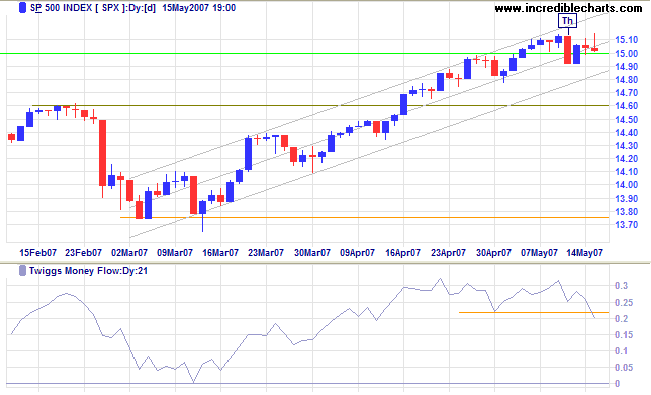
The S&P 500 encountered stiff selling over the last two days, but has so far held above the new support level at 1500. A fall below last Thursday's low of 1490 would warn of a secondary correction, while recovery above 1510 would signal another test of the upper trend channel. Twiggs Money Flow signals short-term distribution; a more serious longer-term signal if the indicator starts to trend downwards.
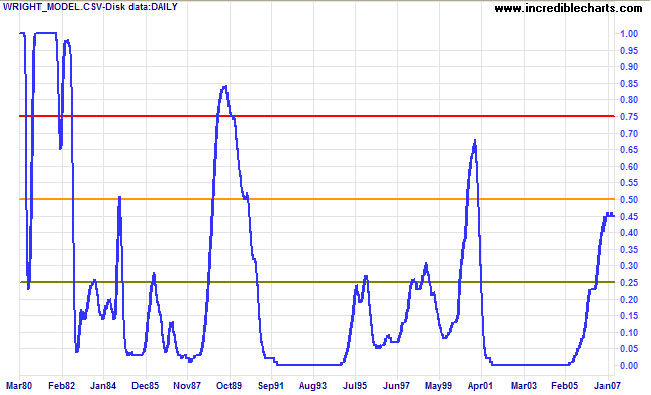
Wright Model
Probability of recession in the next four quarters remains at 45 per cent according to the Wright Model.
No man is entitled to the blessings of freedom unless he be
vigilant in its preservation.
~ General Douglas MacArthur
To understand my approach, please read Technical Analysis & Predictions in About The Trading Diary.

Author: Colin Twiggs is a former investment banker with almost 40 years of experience in financial markets. He co-founded Incredible Charts and writes the popular Trading Diary and Patient Investor newsletters.
Using a top-down approach, Colin identifies key macro trends in the global economy before evaluating selected opportunities using a combination of fundamental and technical analysis.
Focusing on interest rates and financial market liquidity as primary drivers of the economic cycle, he warned of the 2008/2009 and 2020 bear markets well ahead of actual events.
He founded PVT Capital (AFSL No. 546090) in May 2023, which offers investment strategy and advice to wholesale clients.
