Strong S&P 500 Earnings Growth
By Colin Twiggs
May 12, 2007 3:00 a.m. EST (5:00 p.m. AEST)
These extracts from my trading diary are for educational purposes and should not be interpreted as investment advice. Full terms and conditions can be found at Terms of Use.
USA: Dow, Nasdaq and S&P500
The Dow Jones Industrial Average is testing the upper
border of the trend channel. Rising
Twiggs Money Flow (21-day) signals accumulation. Reversal
below 13000 would warn of retracement to test the lower channel
border. Reversal below 12000 is unlikely, but would warn of
another secondary correction.
Channel lines in the chart below are not symmetrical: I have
dragged the top channel line closer to the linear regression
line because in this case data is not evenly distributed around
the LR line.
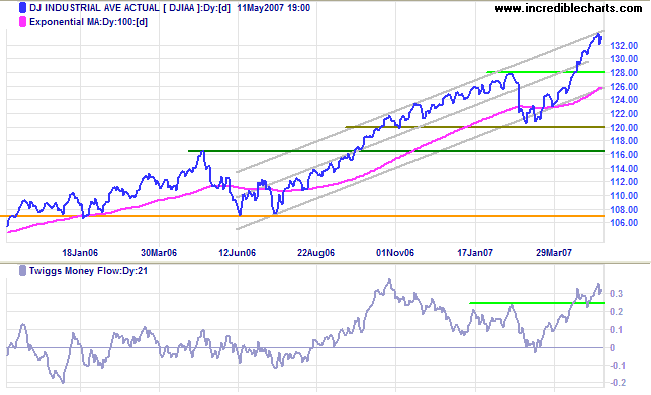
Long Term: The primary up-trend continues, with the
first line of support at the May 2006 peak of 11600 and primary
support at the June 2006 low of 10700.
A few days ago I used the low dividend yield on the Dow and
S&P 500 to argue that we are in
phase 3 of a bull market. That is incorrect. The market is
still in Phase 2. We are experiencing an accelerating up-trend,
but the cause is improved earnings growth, not market
euphoria.
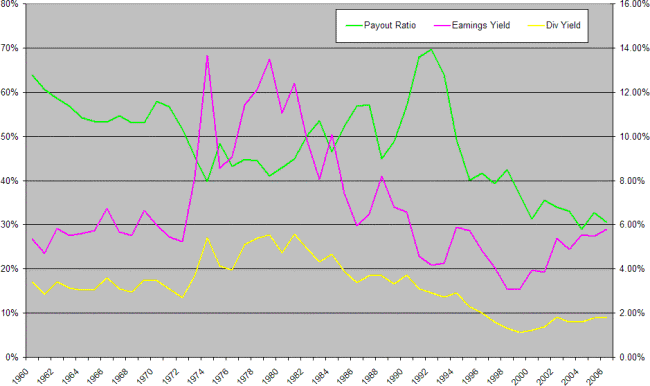
While the dividend yield on the S&P 500 may be a low 1.8%,
earnings yields are close to the 6% experienced during the
1960s and 70s. What has changed is the dividend payout ratio
(dividends as a percentage of earnings), declining from 60% in
the early 60s to 30% today. This should (theoretically) result
in higher earnings growth as capital retained for investment
(or share buy-backs) grows at a faster rate.
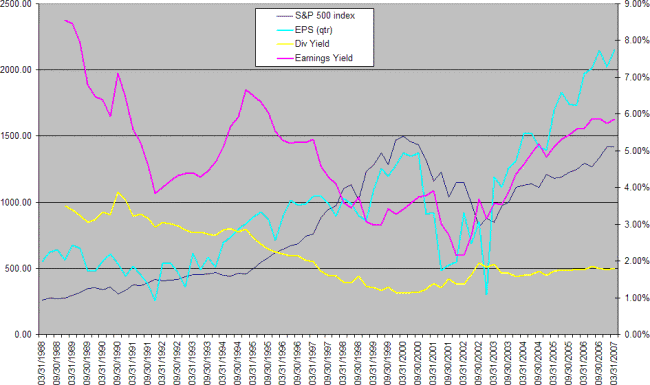
The chart below shows that quarterly earnings (EPS) are growing at a faster rate than the index. Phase 3 will be signaled when index growth overtakes earnings - with a resultant fall in earnings yields.
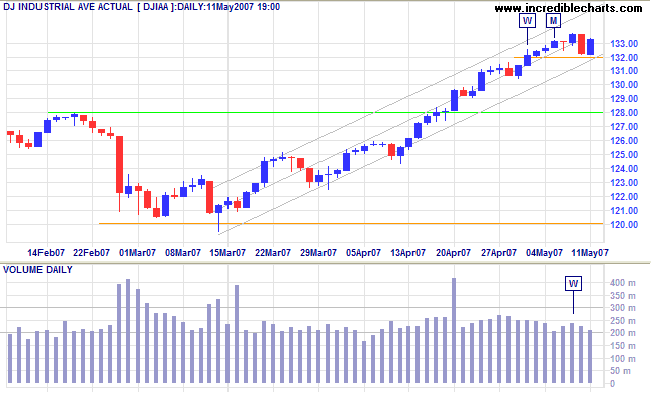
Short Term: The index found support at 13200 and appears set for another test of the upper trend channel - after overcoming resistance at Wednesday's high.
The Dow Jones Transportation Average is consolidating between 5000 and 5200. Breakout will signal the future direction.
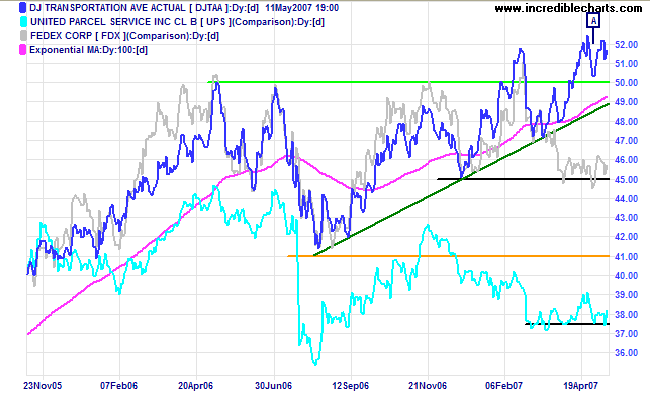
Fedex and UPS both display bearish consolidation during a secondary correction - hinting at an economic slow-down.
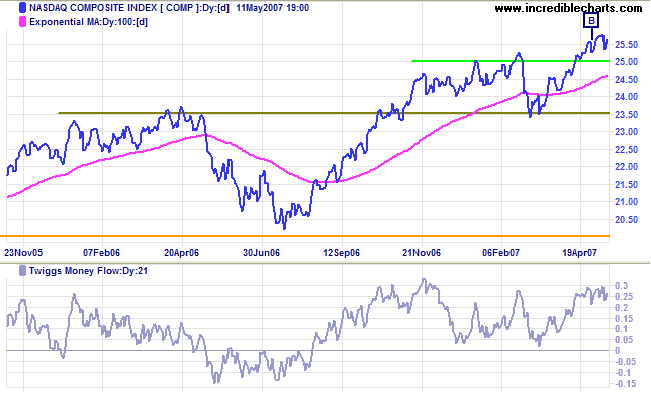
The Nasdaq Composite displays a bullish consolidation
during an up-trend, while
Twiggs Money Flow (21-day) signals long-term accumulation,
having respected the zero line for several months.
Long Term: The primary up-trend continues, with support
at 2350 and 2000.
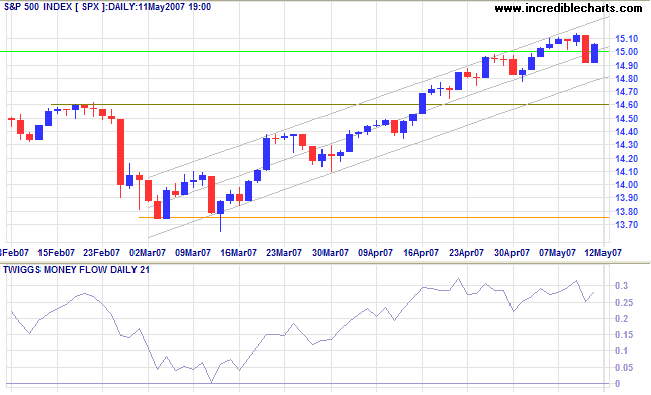
The S&P 500 recovered after falling through the new
support level at 1500. A rise above Wednesday's high would
signal another test of the upper trend channel, but we may see
further consolidation.
Twiggs Money Flow (21-day) is well above zero, signaling
long-term accumulation, but the short-term divergence reflects
some uncertainty. The target for the primary trend move is 1545
(1460 + [1460-1375]).
Long Term: The primary trend is up, with support levels
at 1325 and 1220.
LSE: United Kingdom
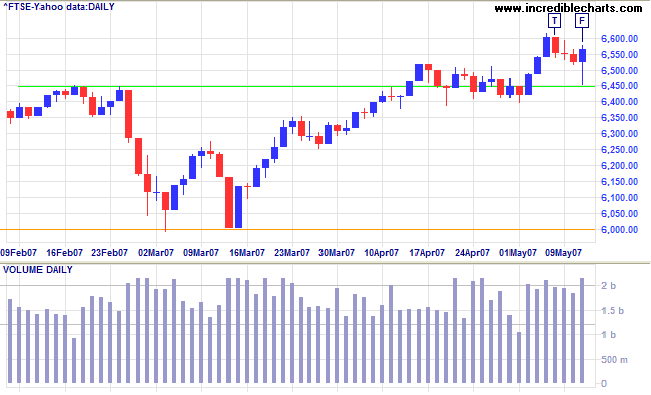
The FTSE 100 retraced to test support at 6450, Friday's
long tail signaling buyer enthusiasm. Recovery above 6600 is
expected and should signal a rally to 6750 (6600 +
[6600-6450]). Reversal below 6400 is unlikely, but would warn
of another correction.
Long Term: The primary up-trend continues. A fall below
6000 is not expected, but would signal a test of primary
support at 5500.
Nikkei: Japan
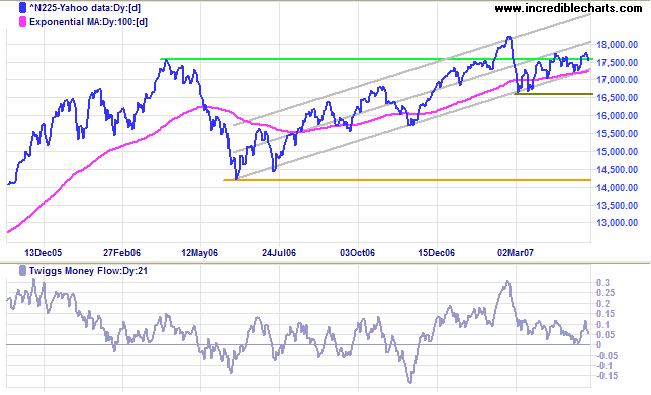
The Nikkei 225 shows a bullish narrow consolidation
below resistance at 17600. A breakout above recent weeks' highs
would signal a test of the upper trend channel; while a break
below the lower channel line would warn of a test of the March
low of 16600 and a possible test of primary support at 14200.
Twiggs Money Flow (21-day) holding above zero signals
accumulation.
Long Term: The primary trend is up.
ASX: Australia
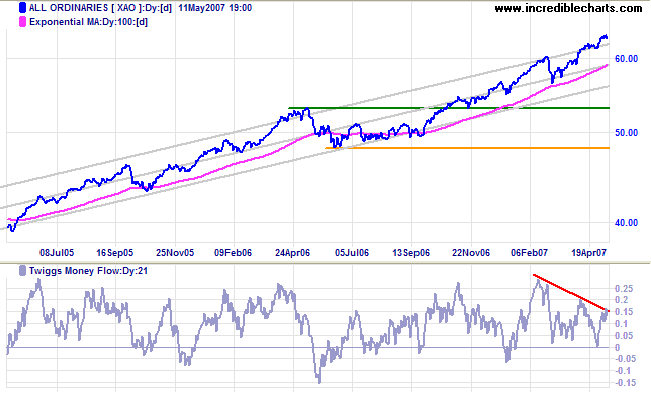
The All Ordinaries up-trend is accelerating - rising
above the upper border of the trend channel. Bearish divergence
on
Twiggs Money Flow (21-day) continues to warn of long-term
profit-taking.
Long Term: The primary up-trend continues, with support
at the May 2006 high of 5300 and the June 2006 low of 4800.
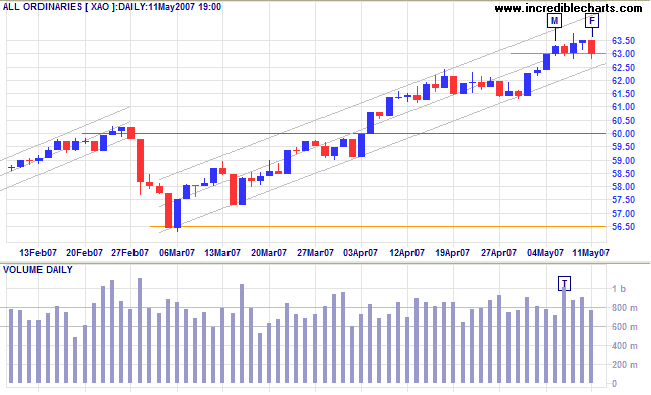
Short Term: Support has so far held at 6300, with buyer commitment signaled by strong volume on Tuesday. Friday's red candle, however, warns of a test of the lower channel line on the chart below. Breakout below the lower channel would warn of a secondary correction, but recovery above 6350 remains more likely, signaling another test of the upper trend channel.
It is fatal to enter any war without the will to win it.
~ General Douglas MacArthur.
To understand my approach, please read Technical Analysis & Predictions in About The Trading Diary.

Author: Colin Twiggs is a former investment banker with almost 40 years of experience in financial markets. He co-founded Incredible Charts and writes the popular Trading Diary and Patient Investor newsletters.
Using a top-down approach, Colin identifies key macro trends in the global economy before evaluating selected opportunities using a combination of fundamental and technical analysis.
Focusing on interest rates and financial market liquidity as primary drivers of the economic cycle, he warned of the 2008/2009 and 2020 bear markets well ahead of actual events.
He founded PVT Capital (AFSL No. 546090) in May 2023, which offers investment strategy and advice to wholesale clients.
