The Bulls Are Back
By Colin Twiggs
April 21, 2007 5.00 p.m. AET (1:00 a.m. ET)
These extracts from my trading diary are for educational purposes and should not be interpreted as investment advice. Full terms and conditions can be found at Terms of Use.
USA: Dow, Nasdaq and S&P500
The Dow Jones Industrial Average is trending strongly
after breaking above its previous high. The recent correction
[A] failed to test support at the previous high of 11600: a
clear sign that we are entering
phase 3 of a bull market.
Twiggs Money Flow (21-day) is climbing sharply, signaling
long-term accumulation.
Reversal below 12000 is highly unlikely, but would signal a
secondary correction.
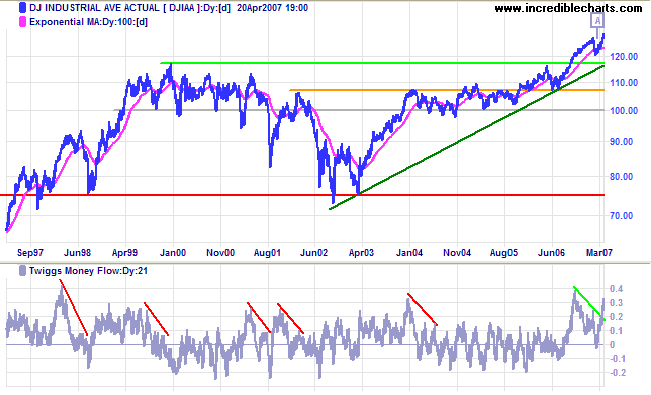
Long Term: The primary up-trend continues. The first line of support is at the May 2006 peak of 11600, with primary support at the June 2006 low of 10700. Recognize that the market is awash with too much money chasing too few stocks (courtesy of the Fed) and may be in for a good run, but don't be blinded by the euphoria.
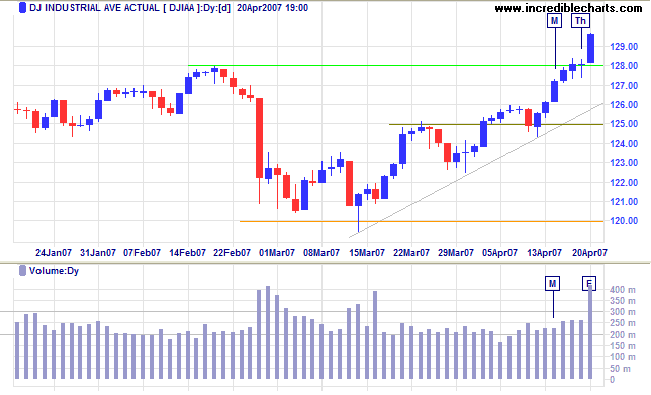
Short Term: The Dow broke through resistance at the previous high of 12800 on massive volume. A sharp rally is likely, as those left behind attempt to climb on board, while retracement to test the new support level would indicate some residual caution.
The Dow Jones Transportation Average broke through resistance at 5000 and its previous high of 5200, signaling continuation of the primary up-trend -- and the wider bull market.
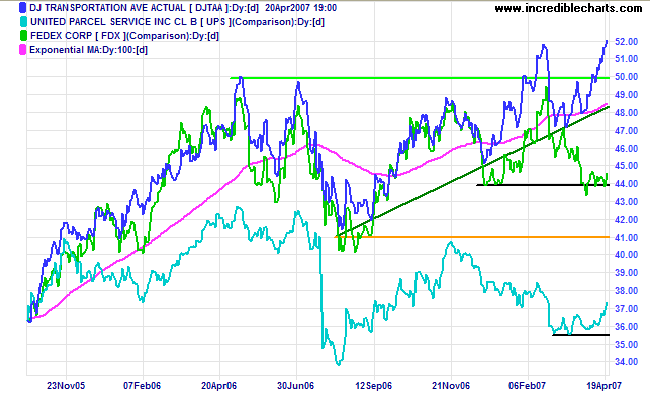
Fedex and UPS have both found support and appear to be following the index.
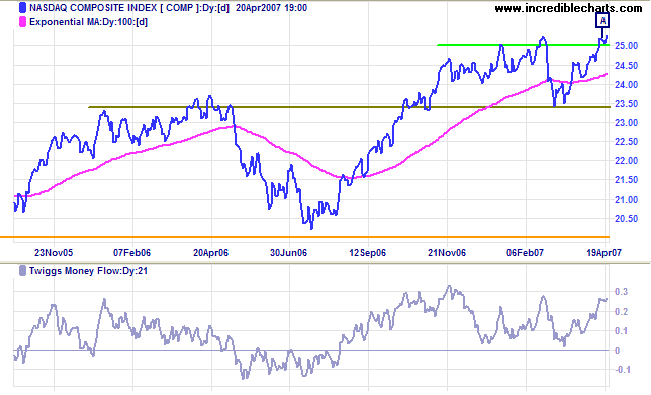
The Nasdaq Composite broke through resistance at 2500, a
short retracement [A] confirming the new support level.
Twiggs Money Flow (21-day) signals long-term accumulation
having respected the zero line for several months.
Long Term: The primary up-trend continues, with support
at 2350 and 2000.
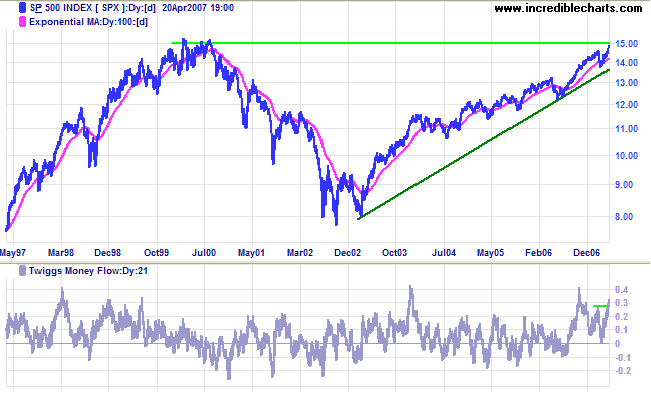
The S&P 500 broke through 1460 and is testing the
key 1500 resistance level.
Twiggs Money Flow (21-day) now signals both short- and
long-term accumulation after breaking above the previous peak.
Narrow consolidation below 1500 would be a further bullish
sign.
Long Term: The primary trend is up, with support levels
at 1325 and 1220.
LSE: United Kingdom
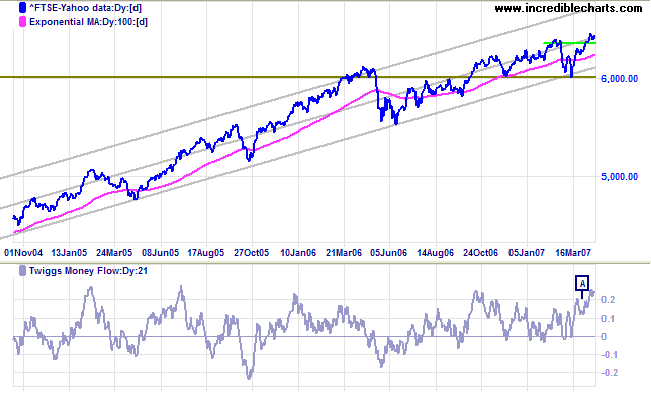
The FTSE 100 is expected to test the upper border of the
standard deviation channel -- close to the key resistance level
of 6800/6900.
Twiggs Money Flow (21-day) is rising steeply, signaling
strong accumulation.
Long Term: The primary up-trend continues. A fall below
6000 is highly unlikely, but would warn of a test of primary
support at 5500.
Nikkei: Japan
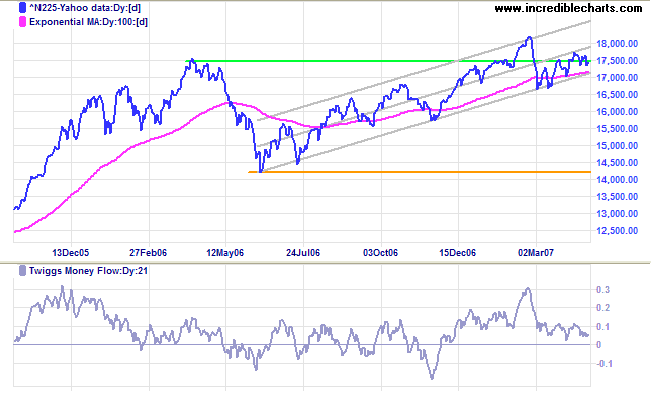
The Nikkei 225 continues to whipsaw around resistance at
17500/17600, but so far has remained within the confines of the
trend channel. The long-term target of 21000 [ 17600 + ( 17600
- 14200 )] is in doubt until a retracement clearly respects
support at the 2006 high. A
Twiggs Money Flow (21-day) break below zero, or the index
falling below 17000, would warn of a secondary
correction.
Long Term: The primary trend remains up, with support at
the June 2006 low of 14200.
ASX: Australia
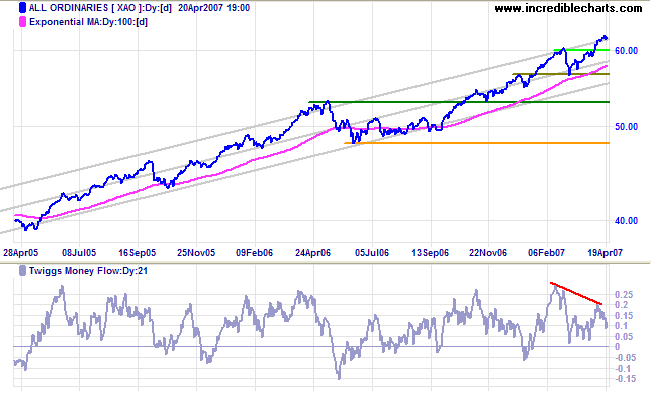
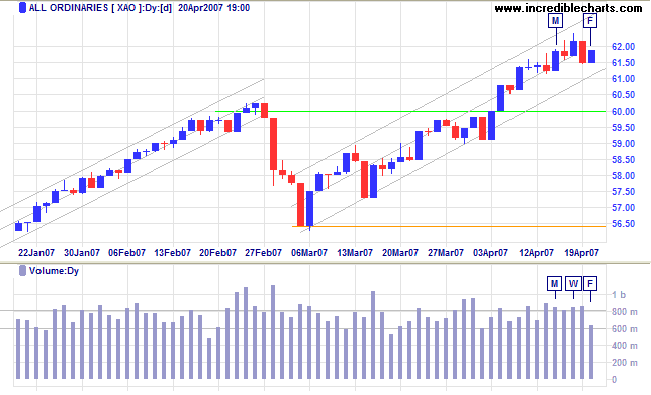
The All Ordinaries shows signs of profit-taking with a
strong bearish divergence on
Twiggs Money Flow (21-day). The index is at the upper
border of the trend channel (drawn at 2 standard deviations
around a linear regression line) and I would normally be on the
alert for signs of a reversal. However, bullish sentiment from
US markets is likely to brush this aside.
Long Term: The primary up-trend continues, with the
first line of support at the May 2006 high of 5300 and primary
support at the June 2006 low of 4800.
Short Term: Further profit-taking is evident, with strong volume for the first four days of the week and weak closes Tuesday to Thursday. Reversal below 6150 would be a bearish sign, but bullish sentiment from the US is expected to boost the index above Wednesday's close, signaling continuation of the rally.
Failure? I never encountered it.
All I ever met were temporary setbacks.
~ Bill Marriott
To understand my approach, please read Technical Analysis & Predictions in About The Trading Diary.

Author: Colin Twiggs is a former investment banker with almost 40 years of experience in financial markets. He co-founded Incredible Charts and writes the popular Trading Diary and Patient Investor newsletters.
Using a top-down approach, Colin identifies key macro trends in the global economy before evaluating selected opportunities using a combination of fundamental and technical analysis.
Focusing on interest rates and financial market liquidity as primary drivers of the economic cycle, he warned of the 2008/2009 and 2020 bear markets well ahead of actual events.
He founded PVT Capital (AFSL No. 546090) in May 2023, which offers investment strategy and advice to wholesale clients.
