The Big Picture
By Colin Twiggs
April 17, 2007 9:30 p.m. ET (11:30 a.m. AET)
These extracts from my trading diary are for educational purposes and should not be interpreted as investment advice. Full terms and conditions can be found at Terms of Use.
Gold
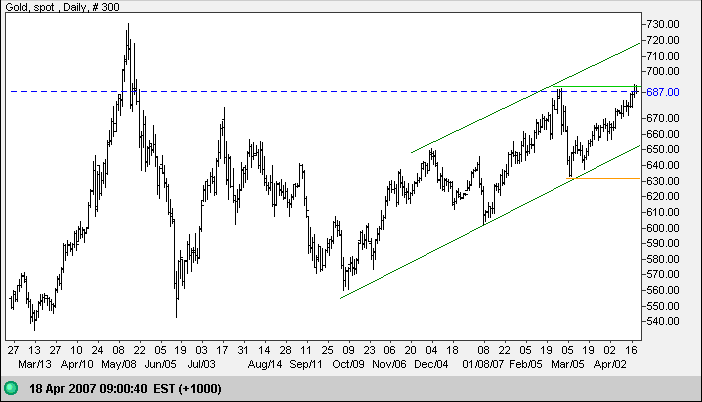
Spot gold is testing resistance at $690. Expect the metal to
overcome resistance and test the upper border of the trend
channel. The target is the May 2006 high of $730 -- less
ambitious than the calculation of $750 ( 690 + [ 690 - 630 ] ).
A fall below support at $630, though unlikely at this stage,
would signal trend reversal.
A fall in crude prices would weaken demand for gold.
Source: Netdania
Crude Oil
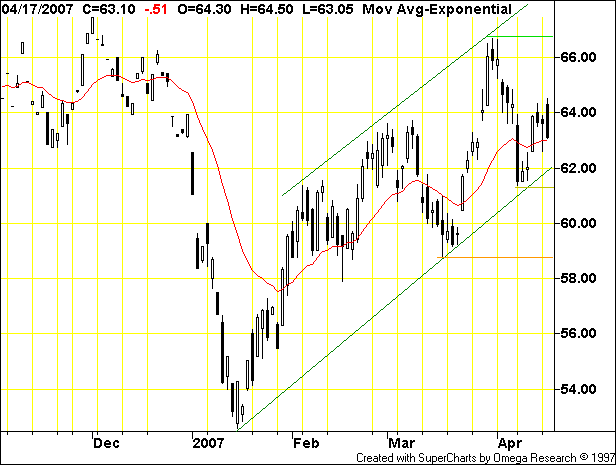
May Light Crude has so far respected the lower border of the trend channel. Breakout below the trend channel would warn that the trend is weakening, while a fall below $59 would confirm that the trend has reversed. Reversal above $64 would signal another rally.
Currencies
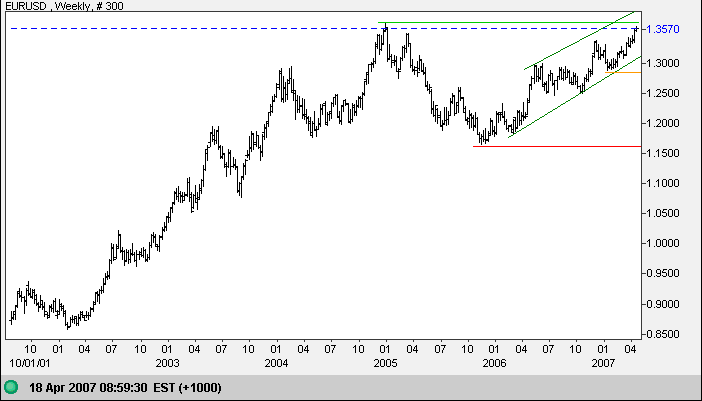
The euro is testing the 2005 high of $1.37. Naarow consolidation below this level would be a bullish sign, while breakout would have a long-term target of $1.57 (1.37 + [ 1.37 - 1.17 ]).
Source: Netdania
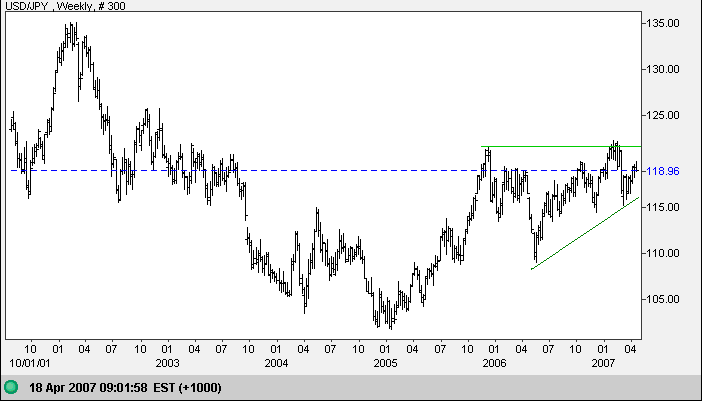
The dollar is forming an ascending triangle against the yen, a bullish formation that would complete if there is a breakout above 122. The target would be the 2001 high of 135; close to the calculated target of 136 (122+[122-110]). Failure of support at 114.00/115.00, on the other hand, would signal reversal to a down-trend.
Source: Netdania
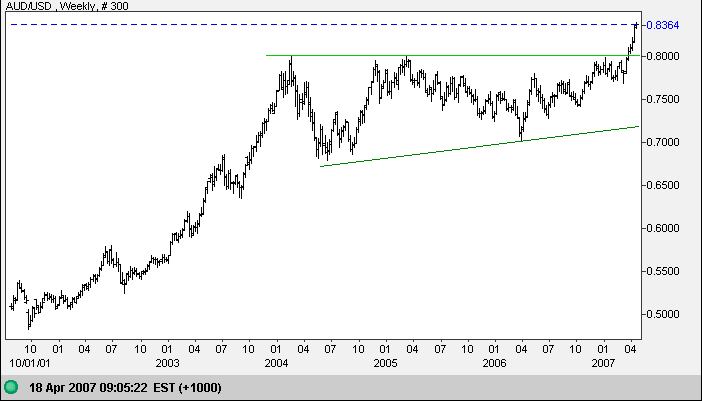
The Australian dollar has a long-term target of 92 (80 + [80 - 68]) from the breakout above a bullish ascending triangle on the weekly chart. Retracements that respect the new support level would present opportunities for traders.
Source: Netdania
On the fundamental side, carry trades may now exceed $1 trillion according to estimates based on the net short interest against the yen on the CME. Carry trades basically take advantage of artificially low interest rates in Japan, borrowing in yen and investing in higher yielding currencies, with the hedge fund/trader pocketing the interest rate spread. The effect is to artificially boost higher-yielding currencies such as the US and Australian dollar while suppressing the value of the yen. So far the Bank of Japan has been exceedingly cautious in raising interest rates as any sudden unwinding of these trades would destabilize exchange rates.
Treasury Yields
Ten-year treasury yields continue to edge upwards. The rate of gain is so slow that it hardly ranks as a trend, judging from the slope of the long-term (green) trendline. A rise above the recent peak of 4.90% would signal another test of 5.25% (for ten-year yields).
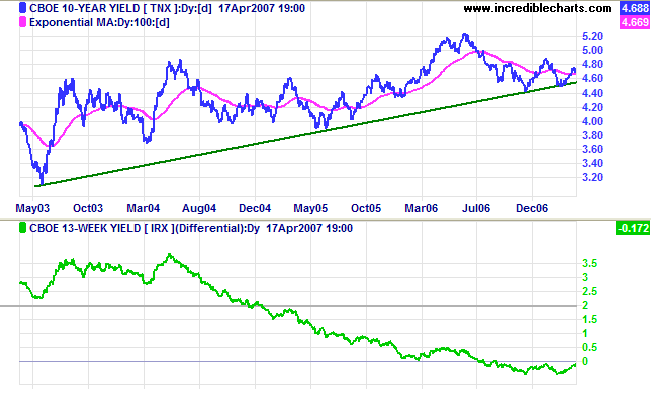
Short-term treasury yields range in a narrow band between 4.80 and 5.00%, causing the negative yield differential (10-year minus 13-week treasury yields) to lessen as long-term yields rise. Reversal above zero would not immediately signal that the market is recovering: the economy may lag interest rates by 1 to 2 years.
The effect of carry trades on the yield curve is difficult to gauge, but they appear to have restricted the Fed's ability to raise long-term rates and slow the economy through increases in short-term rates.
Dow Jones Industrial Average
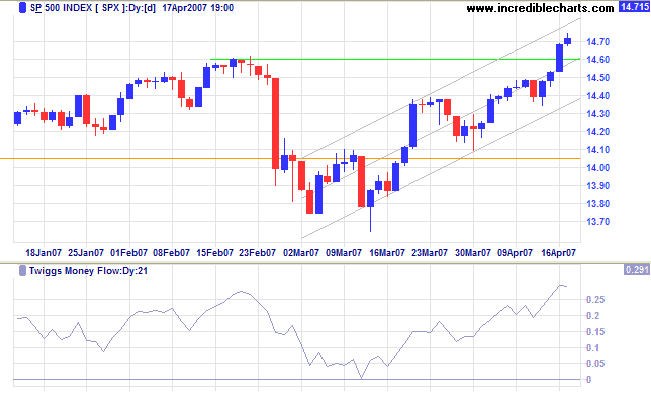
The S&P 500 broke through resistance at the February high of 1460 and the Dow Jones Industrial Average is expected to follow shortly. Twiggs Money Flow signals long- and short-term accumulation.
Wright Model
Probability of recession in the next four quarters continues at 46 per cent according to the Wright Model.
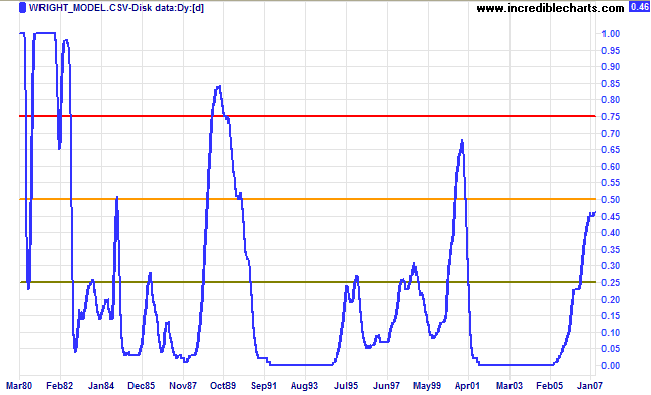
There is some evidence that the Wright model may understate probability of recession in a low interest rate environment (as at present).
Though no one can go back and make a brand new start, anyone
can start from now and make a brand new end.
~ Carl Bard
To understand my approach, please read Technical Analysis & Predictions in About The Trading Diary.

Author: Colin Twiggs is a former investment banker with almost 40 years of experience in financial markets. He co-founded Incredible Charts and writes the popular Trading Diary and Patient Investor newsletters.
Using a top-down approach, Colin identifies key macro trends in the global economy before evaluating selected opportunities using a combination of fundamental and technical analysis.
Focusing on interest rates and financial market liquidity as primary drivers of the economic cycle, he warned of the 2008/2009 and 2020 bear markets well ahead of actual events.
He founded PVT Capital (AFSL No. 546090) in May 2023, which offers investment strategy and advice to wholesale clients.
