Dow Low Volumes
By Colin Twiggs
April 07, 2007 1.00 a.m. ET (5:00 p.m. AET)
These extracts from my trading diary are for educational purposes and should not be interpreted as investment advice. Full terms and conditions can be found at Terms of Use.
USA: Dow, Nasdaq and S&P500
The Dow Jones Industrial Average is trending upwards, having respected the 100-day moving average. The rally is headed for a test of the upper border of the trend channel (drawn at 2 standard deviations around a linear regression line). A fall below 12000, though not expected, would signal a secondary correction. Continued long-term bearish divergence on Twiggs Money Flow (21-day) warn us to exercise caution when the index approaches its recent high of 12800.
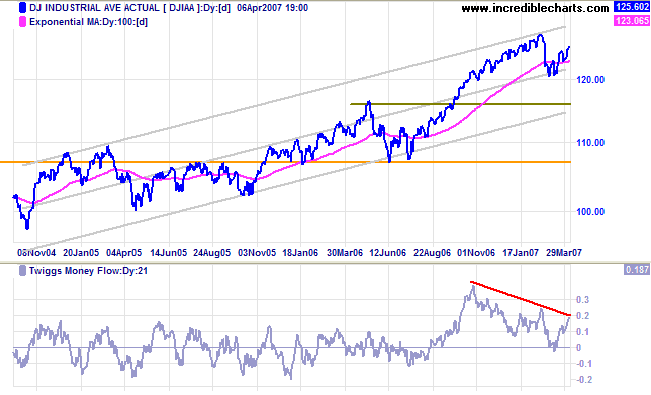
Long Term: The primary trend is up. The first line of support is at the May 2006 peak of 11600, while a fall below the June 2006 low of 10700 would signal reversal to a down-trend.
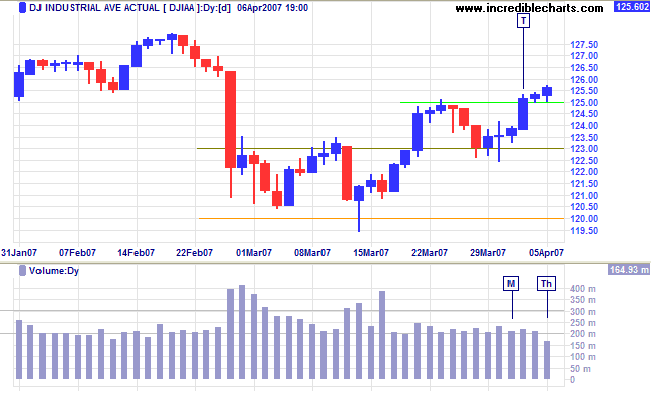
Short Term: The Dow is consolidating above 12500,
maintaining a healthy up-trend. Thursday's volume is low
because of the long weekend. A fall below 12300 is unlikely at
present, but would warn of another test of 12000.
Low volumes over the past 3 weeks are similar to the start of
the last (August 2006) primary up-swing. Activity tends to
later increase near resistance at the previous high (e.g.
12800), then continue in short surges on subsequent rallies
before eventually drying up ahead of a secondary correction.
The Dow Jones Transportation Average continues to respect the long-term (green) trendline and is now headed for a test of resistance at 5000. Breakout above 5000 would signal continuation of the bull market.
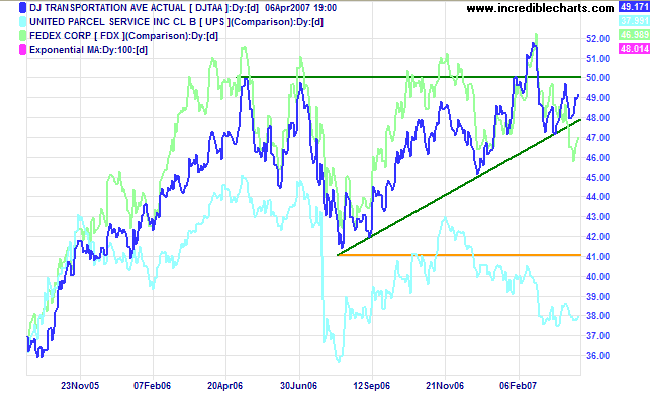
Fedex and UPS also appear to be finding support. Reversal to a primary down-trend would warn that economic activity is slowing.
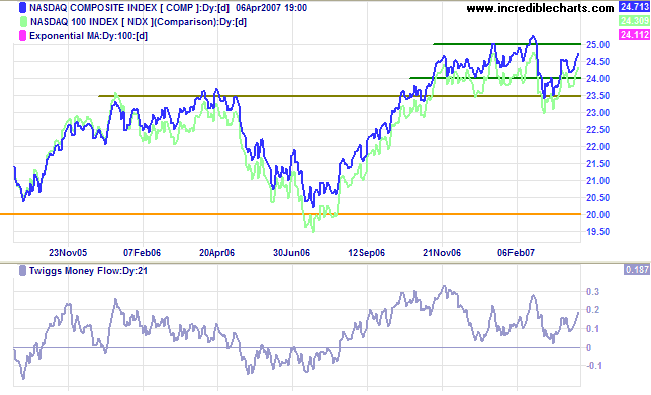
The Nasdaq Composite completed a bullish short
retracement and is headed for a test of resistance at 2500.
Twiggs Money Flow (21-day) is rising, signaling short-term
accumulation.
Breakout above 2500 would be a bullish sign for the entire
equity market; a fall below 2350 would be bearish, warning of a
test of primary support at 2000.
Long Term: The primary trend is up.
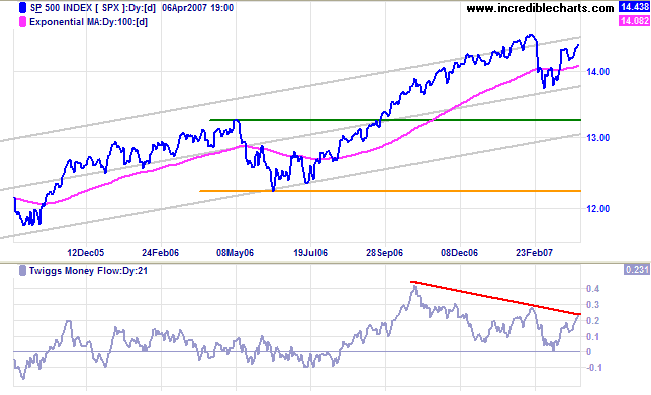
The S&P 500 is headed for a test of the upper border
of the trend channel (drawn at 2 standard deviations around a
linear regression line), but long-term divergence on
Twiggs Money Flow (21-day) continues to warn of
distribution.
Long Term: The primary trend is up, with support levels
at 1325 and 1220.
LSE: United Kingdom
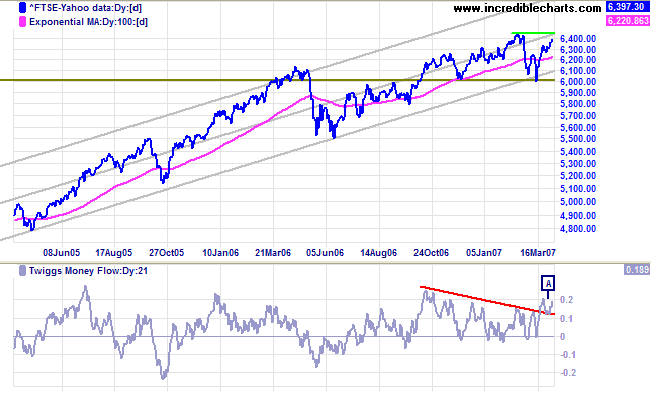
The FTSE 100 is headed for a test of resistance at 6450
after a brief consolidation. A rise above 6450 would signal a
test of the upper border of the trend channel, with a target of
6900 ( 6450 + [6450 - 6000] ).
Twiggs Money Flow (21-day) completed a bullish trough high
above zero at [A]. A fall below 6000 is unlikely, but would
signal a test of primary support at 5500.
Long Term: The primary up-trend continues.
Nikkei: Japan
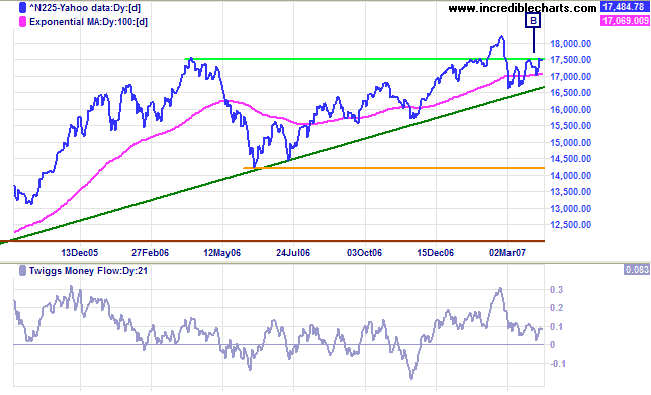
The Nikkei 225 short retracement below resistance at
17500/17600 is a bullish sign. Breakout would signal a target
of 21000 [ 17600 + ( 17600 - 14200 )].
Twiggs Money Flow (21-day) shows short-term weakness, but
holds above zero.
Long Term: The primary trend remains up, with support at
the June 2006 low of 14200.
ASX: Australia
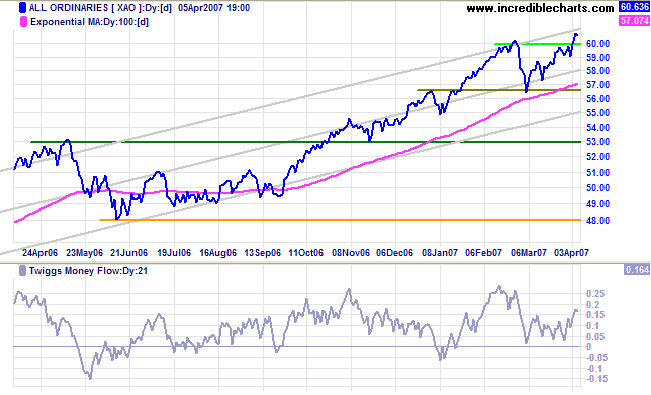
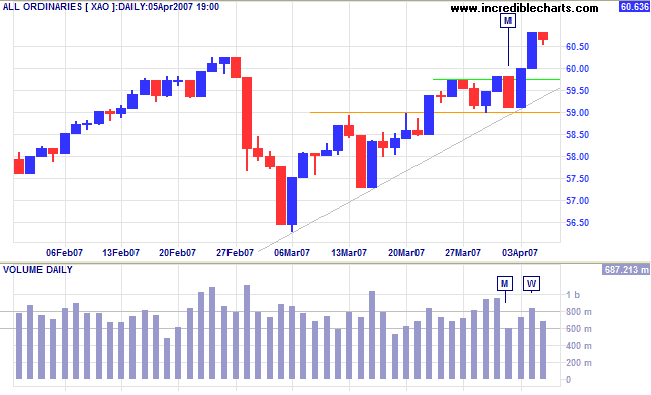
The All Ordinaries broke through resistance at 6000 and
is headed for a test of the upper border of the trend channel.
The target is 6350 ( 6000 + [6000 - 5650] ). Having respected
the zero line,
Twiggs Money Flow (21-day) is rising, signaling
accumulation. Reversal below 5650, though unlikely, would be a
strong bear signal.
Long Term: The primary up-trend continues, with the
first line of support at the May 2006 high of 5300. A fall
below the June 2006 low of 4800 would signal reversal to a
down-trend.
Short Term: Monday's retracement [M] failed to shake out many positions, with low volume and reversal just out of reach of a rich vein of stop orders below 5900. Wednesday's large volume signals resistance, confirmed by Thursday's red candle and narrow range. A retracement that respects support at 6000 would be a bullish sign, while a fall below 5900, though unlikely, would warn of a test of 5650.
Plenty of people miss their share of happiness, not because
they never found it, but because they didn't stop to enjoy
it.
~ William Feather
To understand my approach to technical analysis, please read Technical Analysis & Predictions in About The Trading Diary.

Author: Colin Twiggs is a former investment banker with almost 40 years of experience in financial markets. He co-founded Incredible Charts and writes the popular Trading Diary and Patient Investor newsletters.
Using a top-down approach, Colin identifies key macro trends in the global economy before evaluating selected opportunities using a combination of fundamental and technical analysis.
Focusing on interest rates and financial market liquidity as primary drivers of the economic cycle, he warned of the 2008/2009 and 2020 bear markets well ahead of actual events.
He founded PVT Capital (AFSL No. 546090) in May 2023, which offers investment strategy and advice to wholesale clients.
