The Big Picture
By Colin Twiggs
March 27, 2007 1:00 a.m. ET (4:00 p.m. AET)
These extracts from my trading diary are for educational purposes and should not be interpreted as investment advice. Full terms and conditions can be found at Terms of Use.
Gold
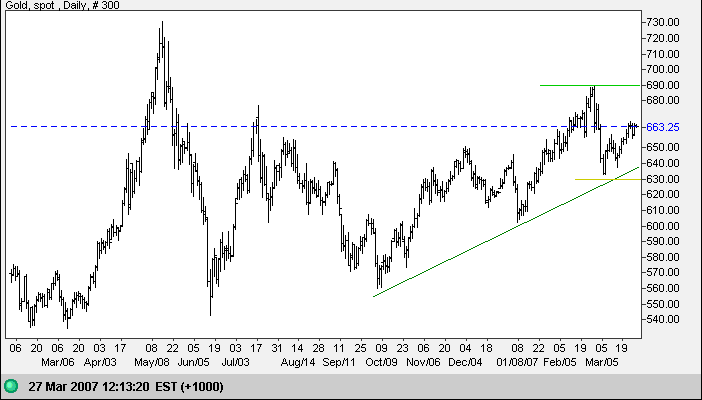
Spot gold continues to respect the long-term (green) trendline,
indicating that the up-trend is healthy. Expect a test of
resistance at $690. Breakout above this level would have a
target of $750 ( 690 + [ 690 - 630 ] ).
Rising crude oil prices may strengthen demand for gold.
Source: Netdania
Crude Oil
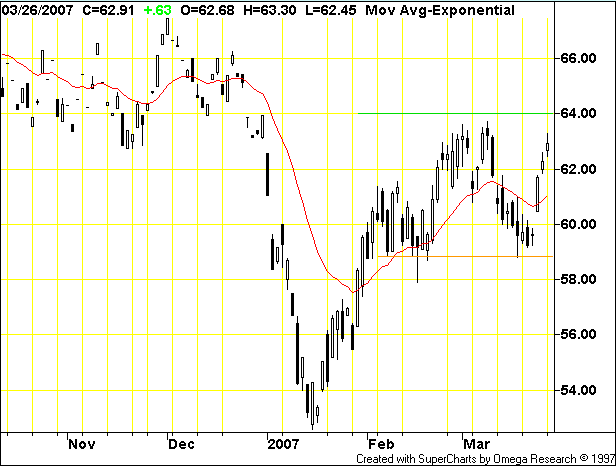
May Light Crude found support at $59/barrel and has rallied sharply to test resistance at $64. Breakout would signal resumption of the up-trend with a target of $69 ( 64 + [ 64 - 59 ] ). Failure would indicate further consolidation between $59 and $64.
Currencies
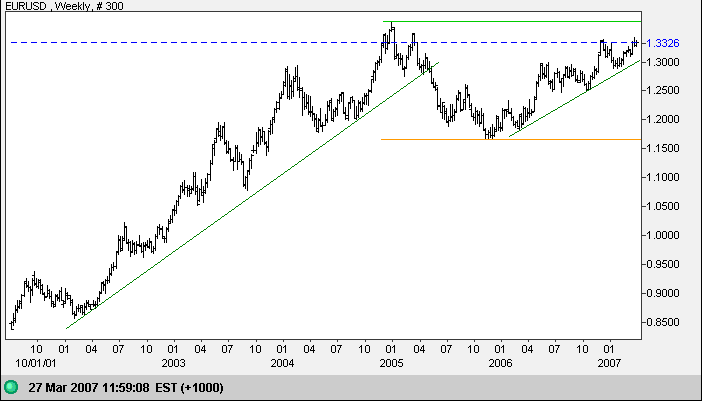
The euro broke through the December 2006 high of $1.34 and is headed for a test of the 2005 high of $1.37. The target for a breakout above $1.37 would be $1.57 ( 1.37 + [ 1.37 - 1.17 ] ).
Source: Netdania
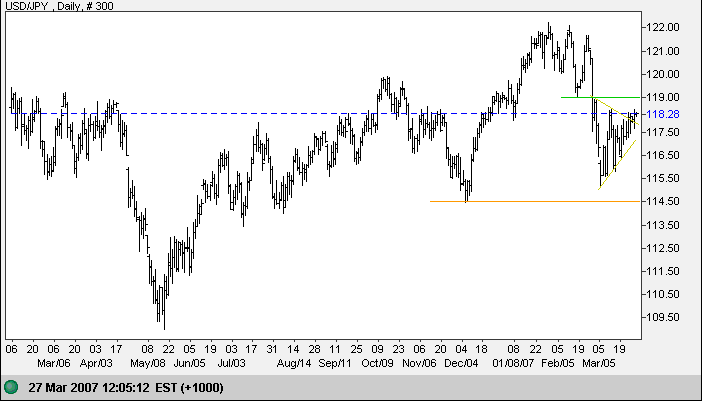
The dollar made a weak upward breakout from its pennant consolidation against the yen. Breakout took place in the last third of the pennant (thanks Neil) and we should not read too much into this unless there is a rise above 119. Respect of resistance would signal another test of 114.50, failure of which would signal reversal to a down-trend and a test of 109. A rise above 119, on the other hand, would signal another test of resistance at 122.
Source: Netdania
Treasury Yields
Ten-year treasury yields are testing the long-term (green) trendline and support at 4.5%. Respect of the trendline would signal another rally to test 5.25%, while failure would warn of reversal to a down-trend. Low (long-term) treasury yields encourage higher valuations in the stock market, offsetting to some extent the negative impact of an inverted yield curve.
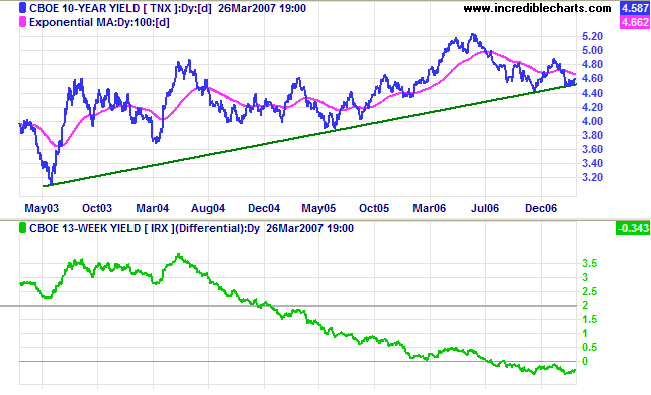
The negative yield differential (10-year minus 13-week treasury yields) continues to warn of pressure on banking margins and contraction of bank credit, restricting new investment.
Dow Jones Industrial Average
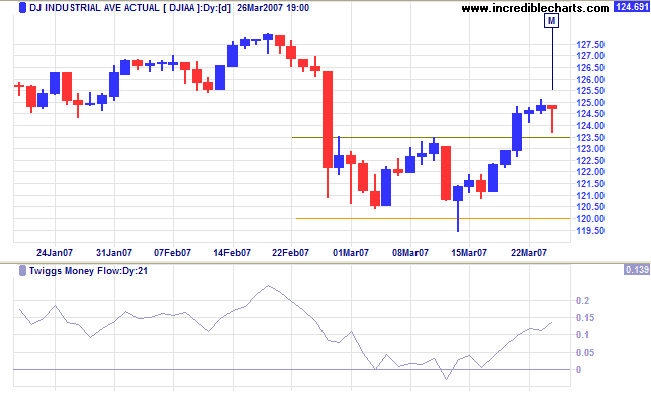
The Dow Jones Industrial Average broke through resistance at 12350 and displays a bullish long tail after a retracement to test the new support level at [M]. Twiggs Money Flow is rising strongly above zero, signaling short-term accumulation. Expect recovery above 12500 and a test of resistance at 12800. Reversal below 12350 is unlikely, but would warn of another test of support at 12000.
Wright Model
Probability of recession in the next four quarters has crept up to 46 per cent according to the Wright Model.
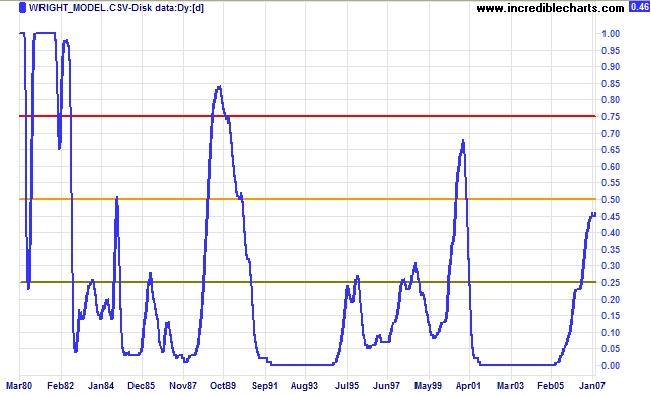
There is some evidence that the Wright model may understate probability of recession in a low interest rate environment (as at present).
We have been misled by a false dichotomy: inflation or
unemployment. That option is an illusion. The real option is
only whether we have higher unemployment as a result of higher
inflation or as a temporary side effect of curing
inflation.
~ Milton Friedman: Free To Choose
To understand my approach, please read Technical Analysis & Predictions in About The Trading Diary.

Author: Colin Twiggs is a former investment banker with almost 40 years of experience in financial markets. He co-founded Incredible Charts and writes the popular Trading Diary and Patient Investor newsletters.
Using a top-down approach, Colin identifies key macro trends in the global economy before evaluating selected opportunities using a combination of fundamental and technical analysis.
Focusing on interest rates and financial market liquidity as primary drivers of the economic cycle, he warned of the 2008/2009 and 2020 bear markets well ahead of actual events.
He founded PVT Capital (AFSL No. 546090) in May 2023, which offers investment strategy and advice to wholesale clients.
