Dow Recovery
By Colin Twiggs
March 24, 2007 1.00 a.m. ET (5:00 p.m. AET)
These extracts from my trading diary are for educational purposes and should not be interpreted as investment advice. Full terms and conditions can be found at Terms of Use.
USA: Dow, Nasdaq and S&P500
The Dow Jones Industrial Average is headed for a test of resistance at 12800 after breaking through the 100-day moving average. A retracement that respects the MA would confirm the signal. Twiggs Money Flow (21-day) continues to display a long-term bearish divergence, but signals short-term accumulation.
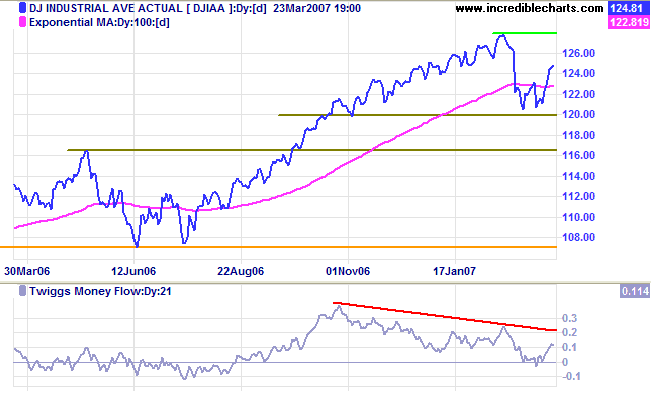
Long Term: The primary up-trend continues. Respect of the May 2006 peak of 11600 would indicate a healthy up-trend, while a fall below the June 2006 low of 10700 would signal reversal to a down-trend.
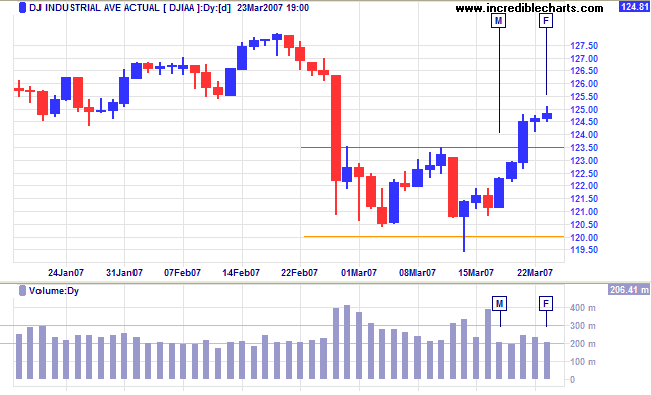
Short Term: The Dow encountered some resistance at 12500 after brief consolidation at Wednesday's high. The bullish position, above the new support level at 12350, means that an upward breakout is likely, which would indicate a test of 12800. Reversal below support at 12350, though not expected, would signal another test of 12000.
The Dow Jones Transportation Average is testing resistance at 5000 after respecting the (green) trendline. Twiggs Money Flow displays a strong accumulation signal at [B] with the trough respecting the zero line. Recovery above 5000 now appears likely, which would signal that the up-trend has resumed.
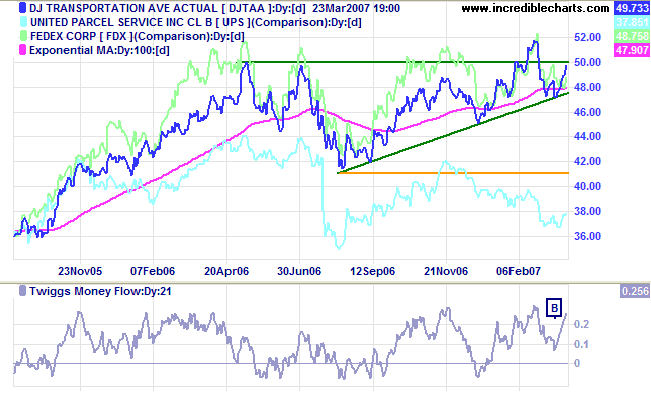
Fedex is ranging sideways, but UPS still looks bearish.
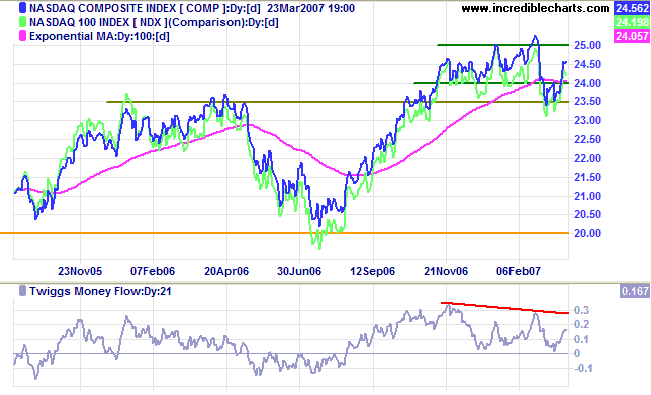
The Nasdaq Composite respected the first level of
primary support at 2350 (at the April 2006 high) and is headed
for a test of 2500. Breakout above 2500 would be a strong bull
signal (for all equity markets), while respect of resistance
would mean further consolidation.
Long Term: The primary trend is up, with support at
2000.
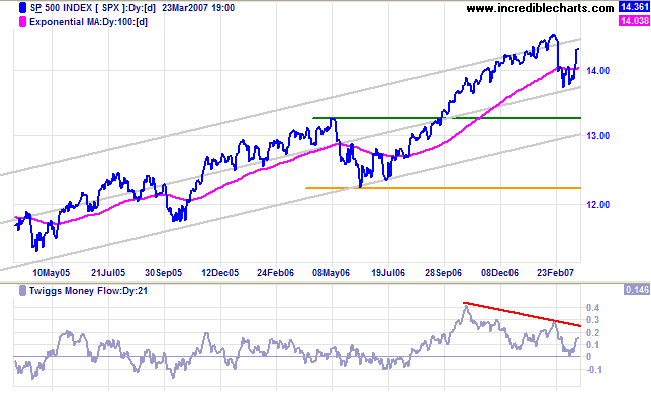
The S&P 500 follows a similar pattern to the Dow and
is headed for a test of the upper border of the trend channel
(drawn at 2 standard deviations around a linear regression
line).
Twiggs Money Flow (21-day) shows a long-term bearish
divergence, warning of distribution, but short-term
accumulation.
Long Term: The primary trend is up, with support levels
at 1325 and 1220.
LSE: United Kingdom
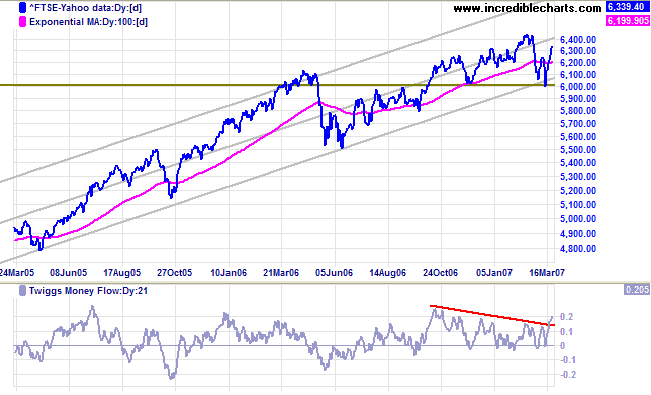
The FTSE 100 rallied steeply after respecting support at
6000. Expect a test of the upper border of the trend channel
(drawn at 2 standard deviations around a linear regression
line).
Twiggs Money Flow (21-day) rising sharply signals strong
accumulation. Breakout above 6400 would give a target of 6800 (
6400 + [ 6400 - 6000 ] ). A fall below 6000 is now unlikely,
but would signal a test of primary support at 5500.
Long Term: The primary up-trend continues.
Nikkei: Japan
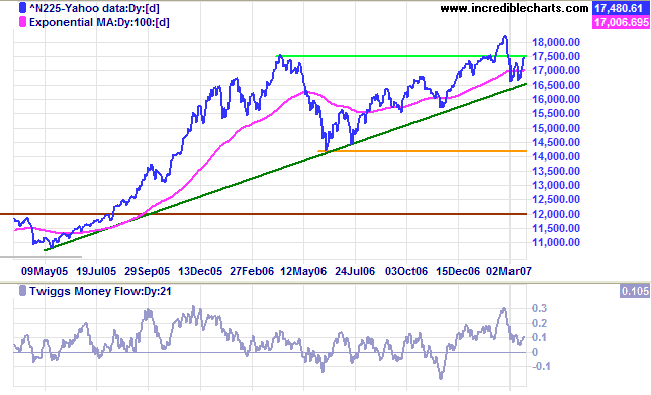
The Nikkei 225 respected the long-term (green) trendline
and is now testing resistance at 17500/17600. Breakout would
signal a target of 21000 [ 17600 + ( 17600 - 14200 )].
Twiggs Money Flow (21-day) shows some short-term weakness,
but is holding well above zero.
Long Term: The primary trend remains up, with support at
the June 2006 low of 14200.
ASX: Australia
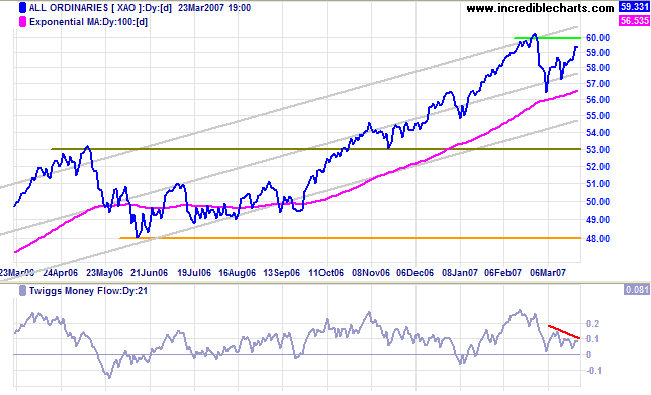
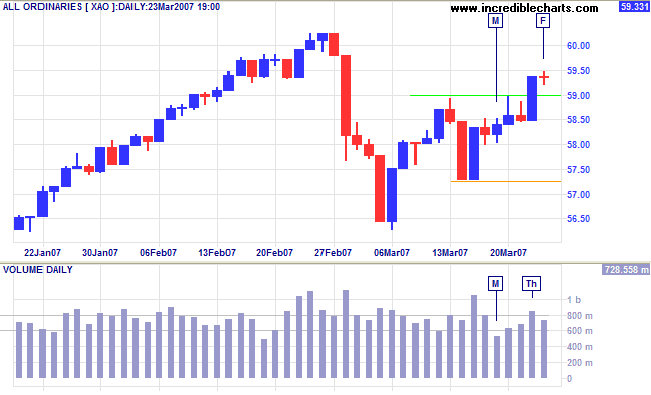
The All Ordinaries is headed for a test of resistance at
6000 after twice respecting the 100-Day moving
average. Breakout above 6000 would be a bullish sign, with
a target of 6350 ( 6000 + [ 6000 - 5650 ] ).
Twiggs Money Flow (21-day) shows a short-term bearish
divergence, warning of selling into the trend. Expect
significant resistance at 6000 and reversal at this level would
be a strong bear signal.
Long Term: The primary up-trend continues. The first
line of support is the May 2006 high of 5300, while a fall
below the June 2006 low of 4800 would signal reversal to a
down-trend.
Short Term: The week started with several weak closes before Thursday's break through resistance at 5900 on strong volume. The doji at [F] is in a bullish position, above the new support level, and a rise above 5950 would signal a test of 6000. Though not expected, a fall below 5900 would warn of a test of last week's low.
The greatest blessing of our democracy is freedom. But in the
last analysis, our only freedom is the freedom to discipline
ourselves.
~ Bernard Baruch
To understand my approach to technical analysis, please read Technical Analysis & Predictions in About The Trading Diary.

Author: Colin Twiggs is a former investment banker with almost 40 years of experience in financial markets. He co-founded Incredible Charts and writes the popular Trading Diary and Patient Investor newsletters.
Using a top-down approach, Colin identifies key macro trends in the global economy before evaluating selected opportunities using a combination of fundamental and technical analysis.
Focusing on interest rates and financial market liquidity as primary drivers of the economic cycle, he warned of the 2008/2009 and 2020 bear markets well ahead of actual events.
He founded PVT Capital (AFSL No. 546090) in May 2023, which offers investment strategy and advice to wholesale clients.
