Dow Support At 12000
By Colin Twiggs
March 17, 2007 1.00 a.m. ET (5:00 p.m. AET)
These extracts from my trading diary are for educational purposes and should not be interpreted as investment advice. Full terms and conditions can be found at Terms of Use.
USA: Dow, Nasdaq and S&P500
The Dow Jones Industrial Average is holding below the 100-day moving average, warning of a secondary correction. Penetration of support at 12000 would confirm. Twiggs Money Flow (21-day) continues its down-trend; a fall below zero would signal short-term selling, while a rally that fails to rise above zero would signal long-term distribution.
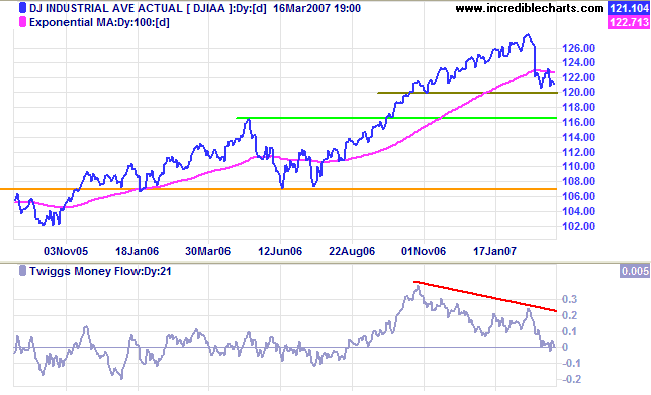
Long Term: The average remains in a primary up-trend. Respect of the May 2006 peak of 11600 would signal a healthy up-trend, while a fall below the June 2006 low of 10700 would signal reversal to a down-trend.
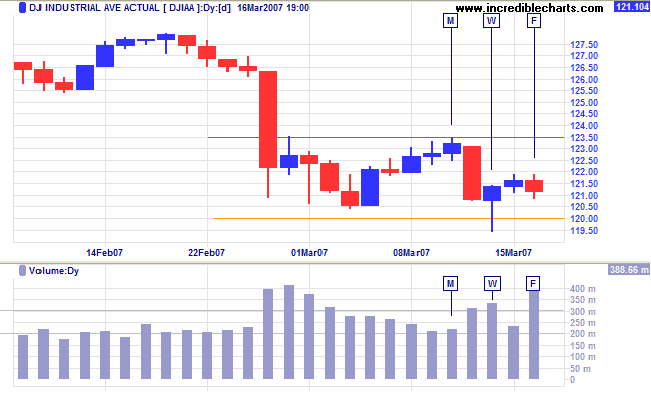
Short Term: The Dow is consolidating between 12000 and 12350, with an attempted breakout at [W] meeting solid support. The bullish sign was negated two days later, however, with the narrow candle and large volume at [F] warning of committed selling. A rise above 12200 on Monday would be bullish, but a drop below 12100 is more likely and would signal another test of support at 12000.
The Dow Jones Transportation Average holding below 5000 is mildly bearish. and a drop below 4100 would signal that the primary trend has reversed. Probabilities appear about even for (i) a fall below 4500, warning of a test of primary support at 4100, and (ii) recovery above 5000, signaling that the up-trend has resumed.
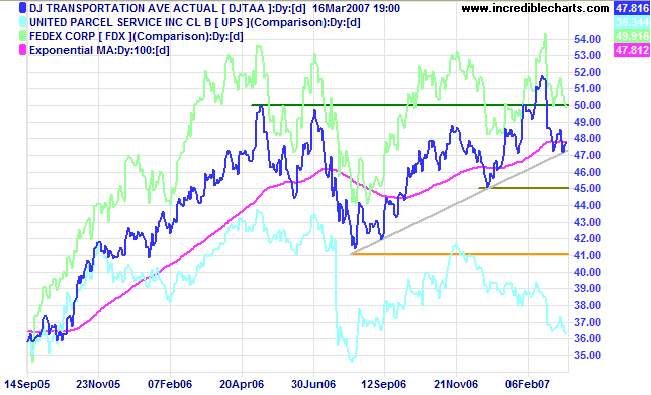
Fedex is ranging sideways, but UPS is falling and a break below the August 2006 low would warn that the economy is slowing.
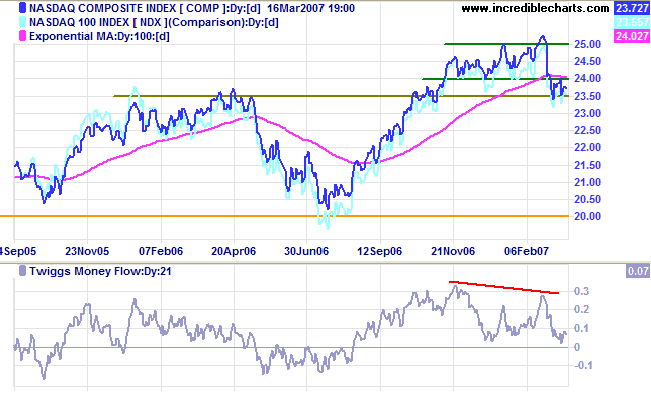
The Nasdaq Composite is in a bearish consolidation below
the 100-day moving
average. Penetration of support at 2340 would signal a test
of the July 2006 low of 2000, while a (less likely) rise above
2400 would be a healthy sign for the primary up-trend.
Long Term: A fall below 2000 would signal reversal to a
primary down-trend.
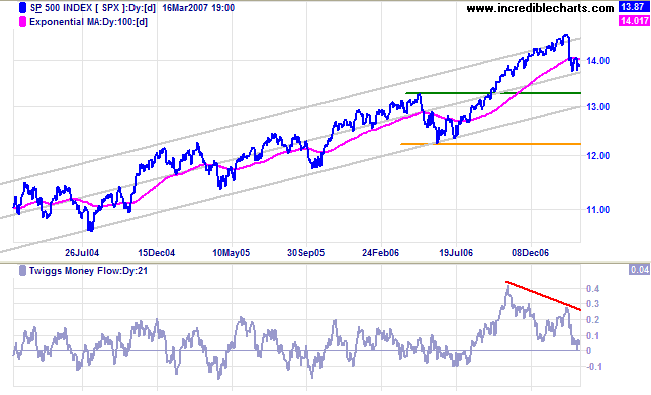
The S&P 500 is consolidating below the 100-Day
moving
average and appears headed for a test of the lower border
of the trend channel, (drawn at 2 standard deviations around a
linear regression line).
Twiggs Money Flow (21-day) bearish divergence warns of
distribution.
Long Term: The primary trend is up. A healthy correction
would respect the first line of support at 1325 (near the lower
channel line), while a fall below 1220 would signal reversal to
a down-trend.
LSE: United Kingdom
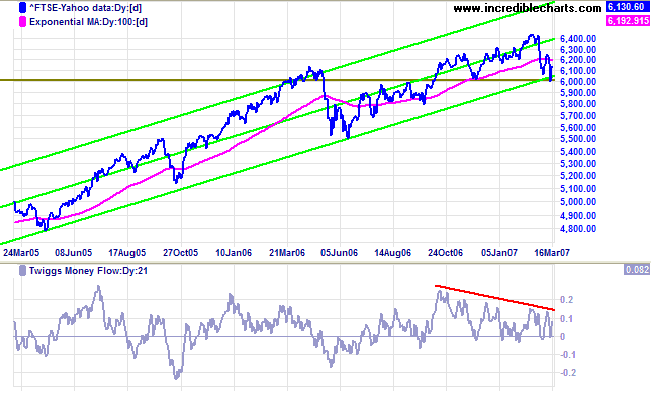
The FTSE 100 is testing support at 6000 and the lower
border of the trend channel, (drawn at 2 standard deviations
around a linear regression line).
Twiggs Money Flow (21-day) holding above zero signals
accumulation. A fall below 6000 would warn of a test of primary
support at 5500, while a close above 6250 would signal
recovery.
Long Term: The primary up-trend continues.
Nikkei: Japan
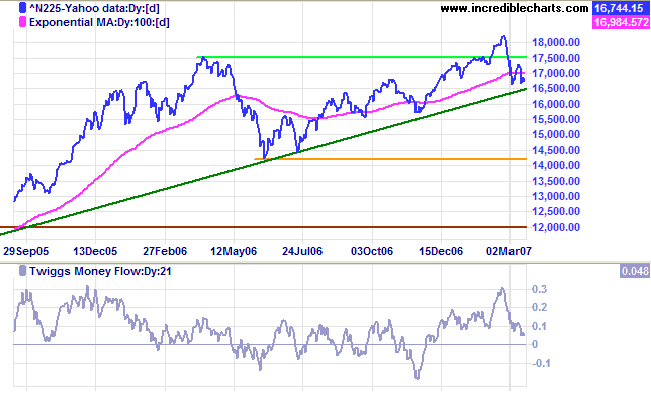
The Nikkei 225 is testing the long-term (green)
trendline; failure would signal that the up-trend is losing
momentum.
Twiggs Money Flow (21-day) is falling faster than the
index, signaling short/medium term weakness.
Long Term: The primary trend remains up, with support at
the June 2006 low of 14200.
ASX: Australia
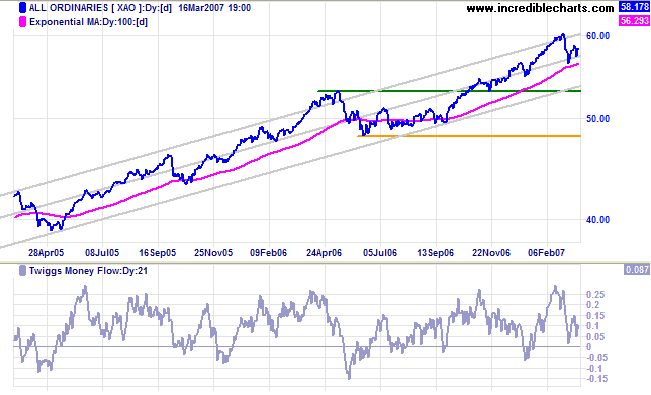
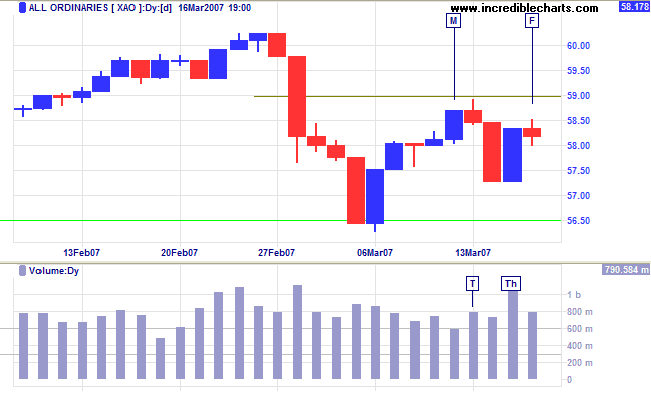
The All Ordinaries has so far respected the 100-Day
moving
average. A downward break would test the lower border of
the trend channel, while a rally above Tuesday's high would
signal a test of the upper border.
Twiggs Money Flow (21-day) continues to respect the zero
line, signaling short-term support.
Long Term: The first line of primary support is at the
May 2006 high of 5300. A fall below the June 2006 low of 4800
would signal reversal to a down-trend.
Short Term: Thursday's large volume shows committed buying but this was negated by the narrow candle and strong volume on Friday, warning of resistance. A rise above 5900 would signal a rally to test 6000 -- and that the correction is most likely over. A fall below Wednesday's low, however, would signal a test of support at 5650 and that the correction is likely to continue.
I never buy at the bottom and I always sell too soon.
~ Baron Rothschild in
Reminiscences of a Stock Operator by Edwin Lefevre (1923)
To understand my approach to technical analysis, please read Technical Analysis & Predictions in About The Trading Diary.

Author: Colin Twiggs is a former investment banker with almost 40 years of experience in financial markets. He co-founded Incredible Charts and writes the popular Trading Diary and Patient Investor newsletters.
Using a top-down approach, Colin identifies key macro trends in the global economy before evaluating selected opportunities using a combination of fundamental and technical analysis.
Focusing on interest rates and financial market liquidity as primary drivers of the economic cycle, he warned of the 2008/2009 and 2020 bear markets well ahead of actual events.
He founded PVT Capital (AFSL No. 546090) in May 2023, which offers investment strategy and advice to wholesale clients.
