Declining Volume On The Dow
By Colin Twiggs
March 10, 2007 1.00 a.m. ET (5:00 p.m. AET)
These extracts from my trading diary are for educational purposes and should not be interpreted as investment advice. Full terms and conditions can be found at Terms of Use.
USA: Dow, Nasdaq and S&P500
The Dow Jones Industrial Average is holding below the 100-day moving average, warning of a secondary correction. Expect a test of the long-term (green) trendline -- and support at the May 2006 high of 11600. Twiggs Money Flow (21-day) continues its down-trend; a fall below zero would warn of further distribution.
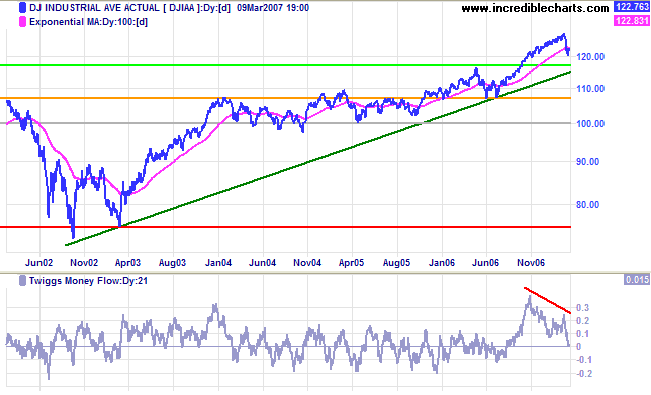
Long Term: The average remains in a primary up-trend. A fall below the June 2006 low of 10700 would signal reversal.
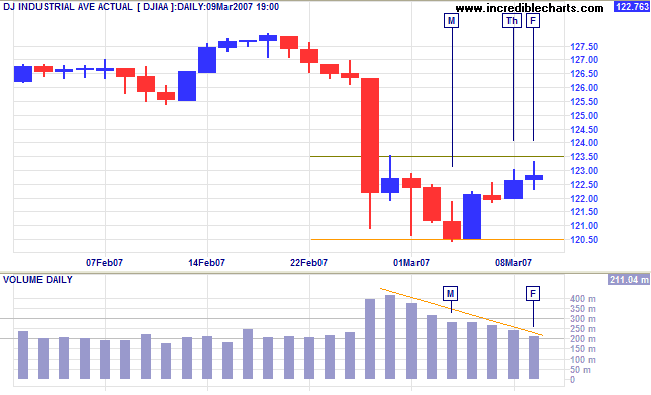
Short Term: The Dow is consolidating, with weak closes and declining volume signaling buyers' lack of interest over the last 3 days. Breakout above 12350 would signal that the correction is slowing, but a fall below 12050 is more likely and would warn of a test of 11600.
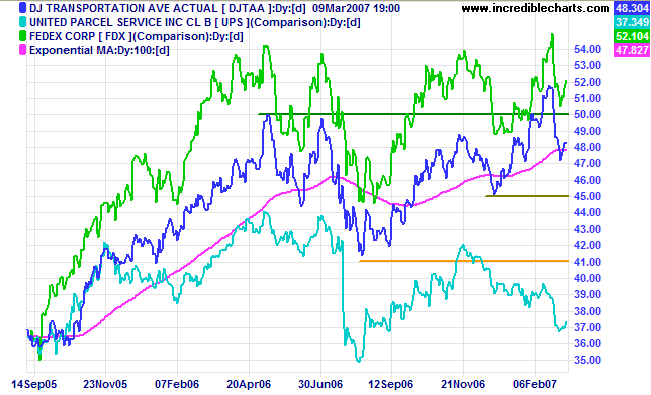
The Dow Jones Transportation Average is holding below 5000, signaling weakness. A fall below 4500 would be bearish, while below 4100 would signal that the primary trend has reversed. Respect of the 100-day moving average and recovery above 5000, though unlikely, would signal that the up-trend has resumed.
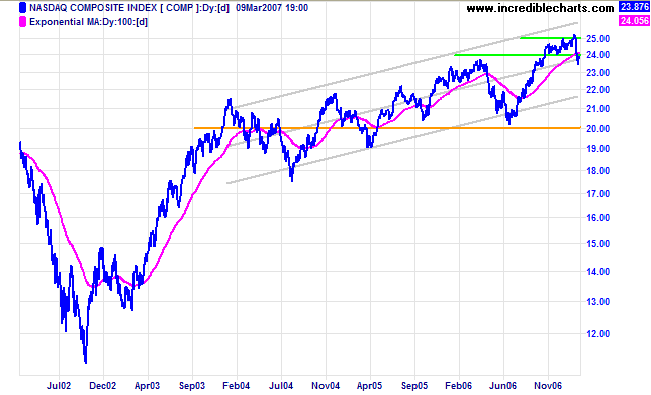
The Nasdaq Composite has so far respected the first line
of primary support at the April 2006 high of 2350, but is
holding below the 100-day moving
average, signaling weakness. Penetration of support would
signal a test of the July 2006 low of
2000.
Long Term: The primary trend is up, but a fall below
2000 would signal reversal.
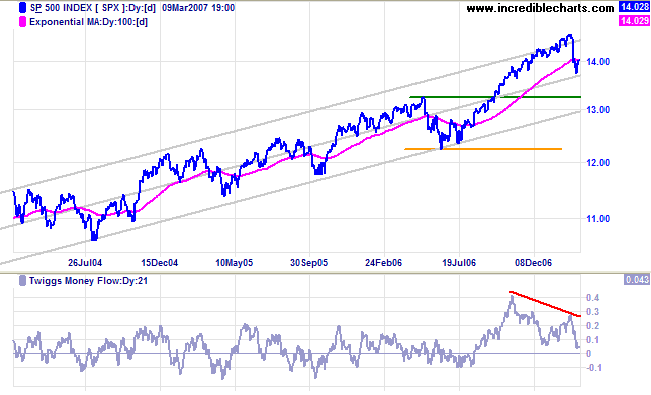
The S&P 500 is holding below the 100-Day moving
average and appears headed for a test of the lower border
of the trend channel, (drawn at 2 standard deviations around a
linear regression line).
Twiggs Money Flow (21-day) bearish divergence warns of
distribution.
Long Term: The primary trend is up. A healthy correction
would test the first line of support at 1325 (near the lower
channel line), while a fall below 1220 would signal reversal to
a down-trend.
LSE: United Kingdom
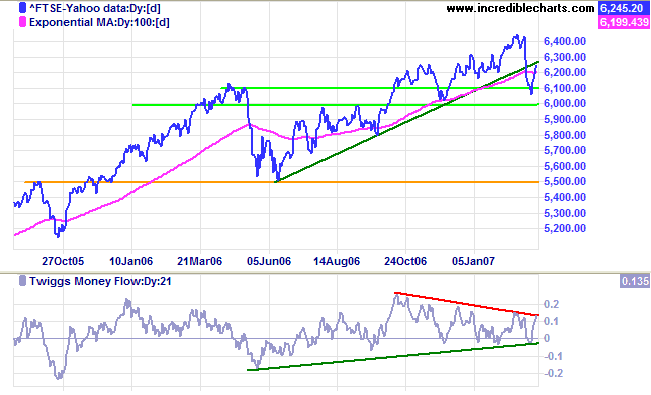
The FTSE 100 respected support at 6000/6100 and
Twiggs Money Flow (21-day) recovered sharply. Expect
further consolidation between 6000 and 6400. A fall below 6000
remains a possibility, however, and would warn of a test of
primary support at 5500.
Long Term: The primary trend remains up.
Nikkei: Japan
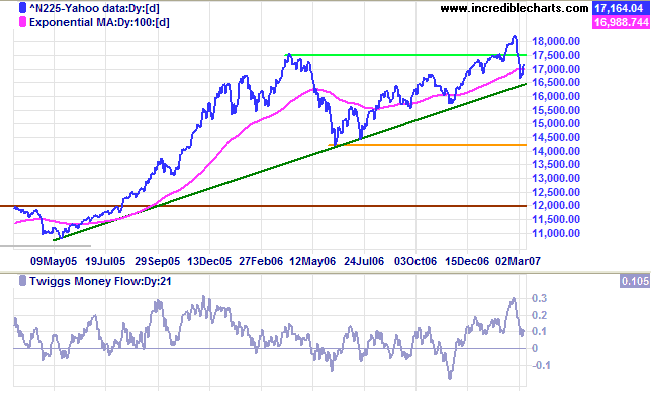
The Nikkei 225 retreated below the first line of support
at 17600, but respected the long-term (green) trendline). The
up-trend appears to have some life left, with
Twiggs Money Flow (21-day) holding well above zero, but the
real test is whether buyers are sufficiently committed to drive
price back above 17600.
The target of 21000 ( 17600 + [ 17600 - 14200 ] ) seems a long
way off at present.
Long Term: The primary up-trend continues, with support
at the June 2006 low of 14200.
ASX: Australia
The All Ordinaries rallied slightly at the center
regression line [3] of the trend channel. This is typical of a
secondary correction, with earlier examples visible at [1] and
[2]. Expect a second downward leg to test the lower border of
the trend channel.
Twiggs Money Flow (21-day) has so far respected the zero
line; a fall below zero would warn of further
distribution.
Long Term: A fall below the first line of primary
support at the May 2006 high of 5300 would signal that the
primary trend is losing momentum. Only a fall below the June
2006 low of 4800, however, would signal a reversal.
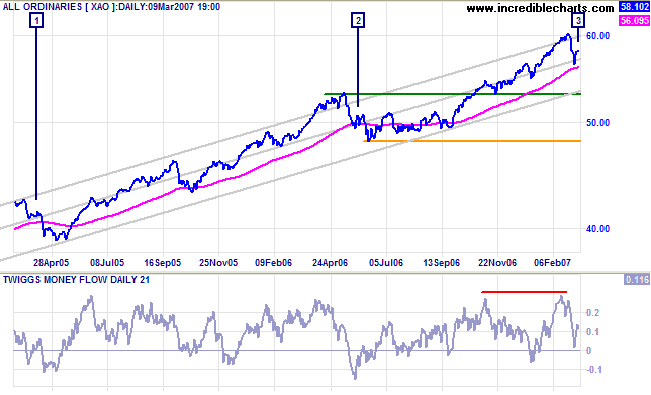
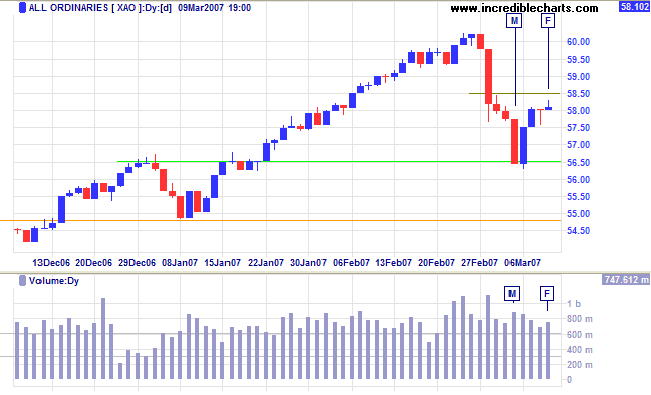
Short Term: The All Ords encountered support at the December high of 5650, signaled by large volume on Monday and Tuesday. The attempted rally, however, ran into resistance, indicated by the hanging man candlestick on Thursday and a weak close with increased volume on Friday. A rise above 5850 is unlikely; and a fall below Tuesday's low would warn of a test of the lower trend channel.
There is a time for all things, but I didn't know it. And that
is precisely what beats so many men in Wall Street who are very
far from being in the main sucker class. There is the plain
fool, who does the wrong thing at all times everywhere, but
there is the Wall Street fool, who thinks he must trade all the
time.
~ Jesse Livermore in Reminiscences of a Stock Operator by Edwin Lefevre (1923)
To understand my approach to technical analysis, please read Technical Analysis & Predictions in About The Trading Diary.

Author: Colin Twiggs is a former investment banker with almost 40 years of experience in financial markets. He co-founded Incredible Charts and writes the popular Trading Diary and Patient Investor newsletters.
Using a top-down approach, Colin identifies key macro trends in the global economy before evaluating selected opportunities using a combination of fundamental and technical analysis.
Focusing on interest rates and financial market liquidity as primary drivers of the economic cycle, he warned of the 2008/2009 and 2020 bear markets well ahead of actual events.
He founded PVT Capital (AFSL No. 546090) in May 2023, which offers investment strategy and advice to wholesale clients.
