Bearish Divergences
By Colin Twiggs
December 9, 2006 7.00 a.m. ET (11:00 p.m. AET)
December 9, 2006 7.00 a.m. ET (11:00 p.m. AET)
These extracts from my daily trading diary are for educational
purposes and should not be interpreted as investment advice.
Full terms and conditions can be found at
Terms of Use. The last newsletter for this year will be on
Saturday, December 16th. The service will resume on January
9th.
The Big Picture
Most indexes, with the possible exception of the FTSE 100 show signs of distribution. It is too early
to tell whether this will mean a correction or merely
consolidation.
January light crude, currently at $62.03/barrel, threatens another rally. The euro encountered resistance at $1.3350 against the dollar and is consolidating at $1.32; appearing headed for a test of the 2005 high of $1.37 in the longer term. Gold retreated to $623.90 after testing $650 and appears headed for a test of support at $615.
Probability of recession in the next four quarters increased to 44 per cent according to the Wright model. A rise above 50% would be cause for concern.
USA: Dow, Nasdaq and S&P500
The Dow Industrial Average rallied to
test resistance at 12350. The short retracement ending Friday
is a bullish sign. Consolidation above 12200 would warn of an
upward breakout.
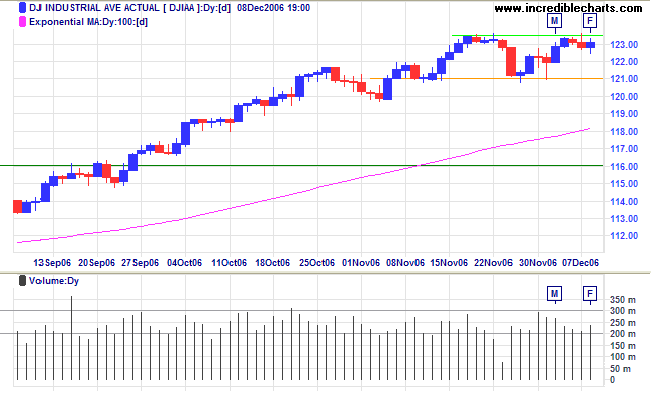
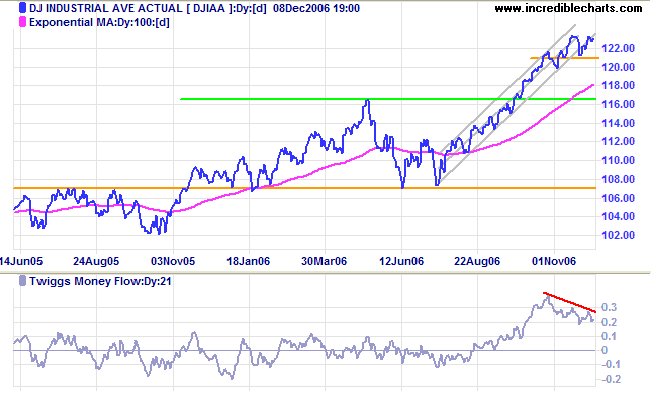
Medium Term: The break below the trend channel of the
last 5 months (drawn at 2 standard deviations around a linear
regression line) signals that the up-trend is slowing and
bearish
divergence on
Twiggs Money Flow (21-day) warns of distribution. The
short-term pattern appears to favor another leg up, but a fall
below 12000 would warn of a secondary correction.
Long Term: The Dow remains in a primary up-trend, with support at 10700.
Long Term: The Dow remains in a primary up-trend, with support at 10700.
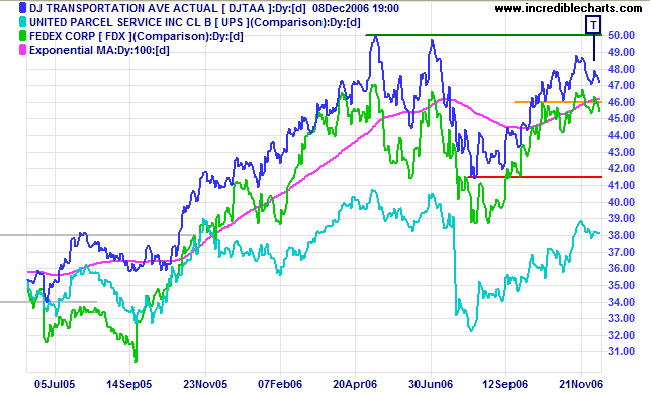
A lower short-term high at [T] would mean that the Dow Jones
Transportation Average is likely to test intermediate
support at 4600. Failure of this level would indicate a test of
primary support at 4150, but respect of 4600, on the other
hand, would mean another test of resistance at 5000. Breakout
above 5000 would confirm the existence of a
bull market.
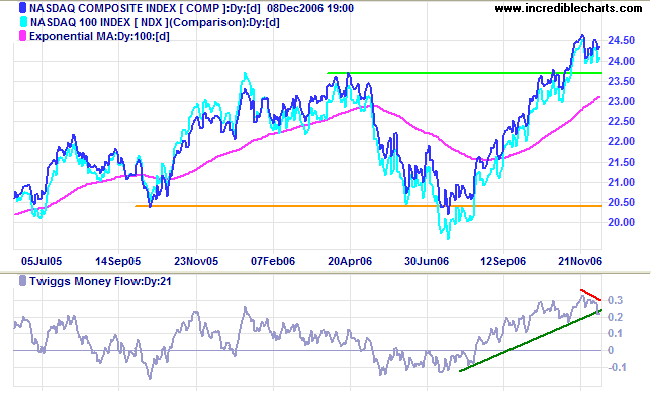
The Nasdaq Composite has encountered selling into the
latest rally, as indicated by the break of the trendline on
Twiggs Money Flow. A test of the new support level at 2370
remains likely. If the support level holds, that would confirm
the up-trend, while failure would signal trend weakness.
The S&P 500 encountered mid-week resistance similar
to the Dow.
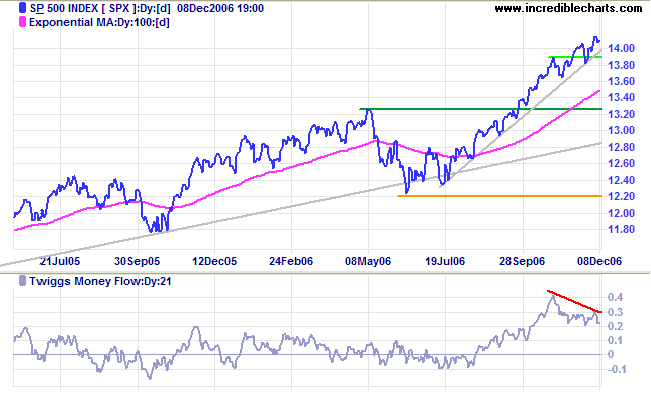
Medium Term: The current up-swing continues, but bearish
divergence on
Twiggs Money Flow (21-day) warns of distribution. Watch for
a break of the 5-month trendline which would warn of a
retracement.
Long Term: The S&P 500 continues in a primary up-trend, with support at 1220.
Long Term: The S&P 500 continues in a primary up-trend, with support at 1220.
LSE: United Kingdom
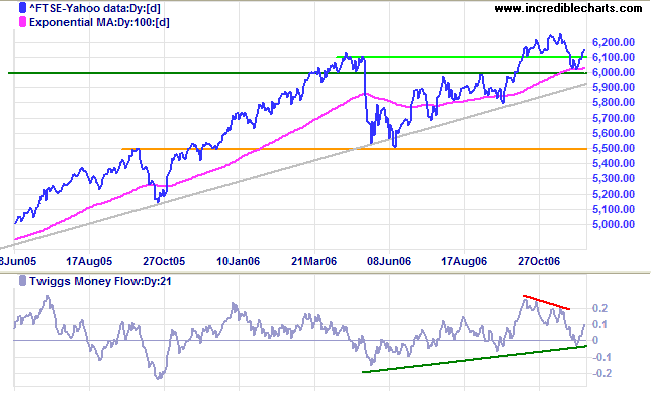
The FTSE 100 recovered strongly above 6100 (from the
April high).
Medium Term: The small double bottom respected support at 6000, the 100-day moving average, and the long-term trendline. Twiggs Money Flow (21-day) recovered strongly above zero. A rise above the recent high of 6250 would complete a bull signal.
Long Term: The primary up-trend continues, with support at 5500.
Nikkei: Japan
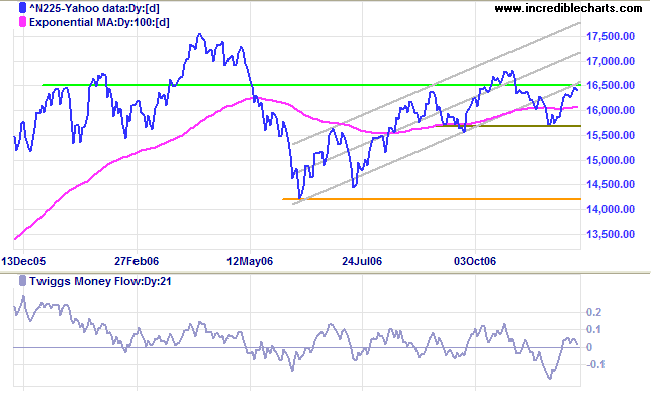
The Nikkei 225 is encountering strong resistance at
16500, indicated by weak closes for the last two days.
Medium Term: Penetration of support at 15700, or reversal of Twiggs Money Flow (21-day) below the zero line, would warn of a test of primary support at 14200.
Long Term: The index remains in a primary up-trend. Primary support will be weakened if the index fails to test its previous high of 17500.
Medium Term: Penetration of support at 15700, or reversal of Twiggs Money Flow (21-day) below the zero line, would warn of a test of primary support at 14200.
Long Term: The index remains in a primary up-trend. Primary support will be weakened if the index fails to test its previous high of 17500.
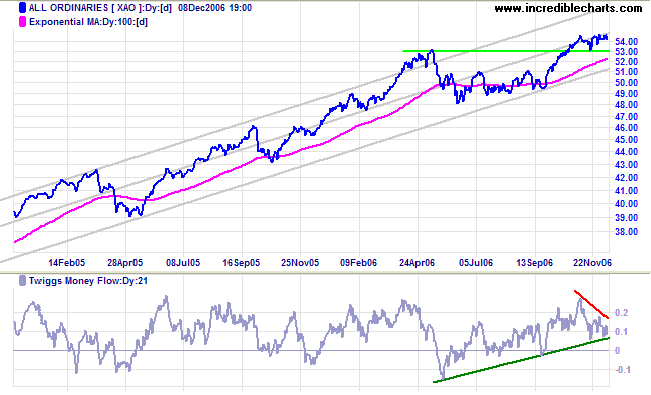
ASX: Australia
The All Ordinaries is having difficulty overcoming
resistance at 5450/5460, with strong volume accompanying the
consolidation. Readers will observe an ascending triangle
between 5300 and 5460. While this is normally a continuation
pattern in an up-trend, I would expect volume to dry up prior
to a breakout. A fall below 5400 would indicate potential
pattern failure, while breakout above 5460 would signal
completion of the pattern and continuation of the up-trend.
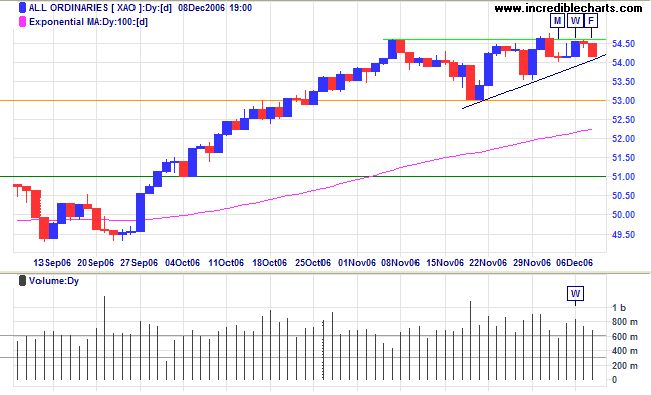
Medium Term: A fall below 5300 would signal that the
lower border of the trend channel (channel lines drawn at 2
standard deviations around a linear regression line) is likely
to be tested, while upward breakout from the consolidation
would indicate a test of the upper channel line.
Twiggs Money Flow (21-day) displays a bearish divergence
warning of distribution and favoring a downward breakout.
Long Term: The All Ordinaries remains in a primary up-trend with support at 4800.
Long Term: The All Ordinaries remains in a primary up-trend with support at 4800.
What the gentleman demands is something of
himself.
What the petty man demands is something of others.
~ The Analects of Confucius
What the petty man demands is something of others.
~ The Analects of Confucius
|
Technical Analysis and Predictions I believe that Technical Analysis should not be used to make predictions because we never know the outcome of a particular pattern or series of events with 100 per cent certainty. The best that we can hope to achieve is a probability of around 80 per cent for any particular outcome: something unexpected will occur at least one in five times. My approach is to assign probabilities to each possible outcome. Assigning actual percentages would imply a degree of precision which, most of the time, is unachievable. Terms used are more general: "this is a strong signal"; "this is likely"; "expect this to follow"; "this is less likely to occur"; "this is unlikely"; and so on. Bear in mind that there are times, especially when the market is in equilibrium, when we may face several scenarios with fairly even probabilities. Analysis is also separated into three time frames: short, medium and long-term. While one time frame may be clear, another could be uncertain. Obviously, we have the greatest chance of success when all three time frames are clear. The market is a dynamic system. I often compare trading to a military operation, not because of its' oppositional nature, but because of the complexity, the continual uncertainty created by conflicting intelligence and the element of chance that can disrupt even the best made plans. Prepare thoroughly, but allow for the unexpected. The formula is simple: trade when probabilities are in your favor; apply proper risk (money) management; and you will succeed. For further background, please read About The Trading Diary. |

Author: Colin Twiggs is a former investment banker with almost 40 years of experience in financial markets. He co-founded Incredible Charts and writes the popular Trading Diary and Patient Investor newsletters.
Using a top-down approach, Colin identifies key macro trends in the global economy before evaluating selected opportunities using a combination of fundamental and technical analysis.
Focusing on interest rates and financial market liquidity as primary drivers of the economic cycle, he warned of the 2008/2009 and 2020 bear markets well ahead of actual events.
He founded PVT Capital (AFSL No. 546090) in May 2023, which offers investment strategy and advice to wholesale clients.