Dollar Decline Continues
By Colin Twiggs
December 05, 2006 8:00 p.m. AEDT (4:00 a.m. ET)
December 05, 2006 8:00 p.m. AEDT (4:00 a.m. ET)
These extracts from my daily trading diary are for educational
purposes and should not be interpreted as investment advice.
Full terms and conditions can be found at
Terms of Use. The last newsletter for this year will be on
Saturday, December 16th. The service will resume on January
9th.
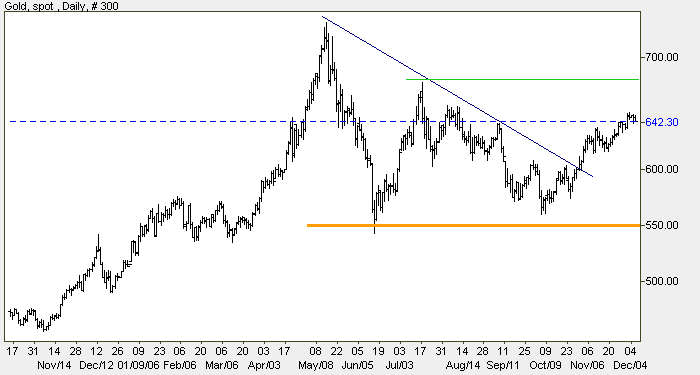
Gold
Spot gold pulled back to test the new support level at $640
after the latest breakout.
Source: Netdania
Medium Term: Expect further resistance at $675. Breakout
above this level, or narrow consolidation below, would be a
strong bull signal.
Long Term: Demand for gold is being driven by the weakening dollar. Stronger oil prices would add further impetus.
Long Term: Demand for gold is being driven by the weakening dollar. Stronger oil prices would add further impetus.
Crude Oil
January 2007 Light Crude broke through resistance at
$63.00/barrel before retreating below.
Medium Term: Reversal above $64.00 would confirm the breakout from the broadening formation. A fall below Monday's low of $62.00 would signal a test of the lower border of the formation.
Medium Term: Reversal above $64.00 would confirm the breakout from the broadening formation. A fall below Monday's low of $62.00 would signal a test of the lower border of the formation.
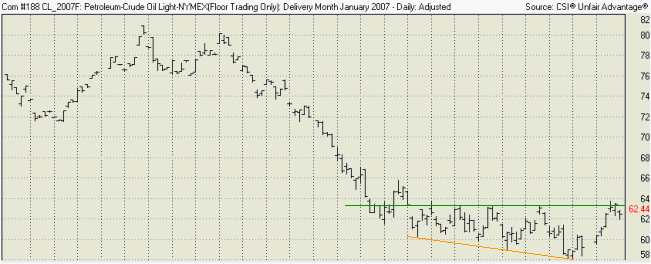
Long Term: Failure of support at $55 would warn of a
long-term down-trend. Consolidation above this level, however,
would establish a base for continuation of the up-trend.
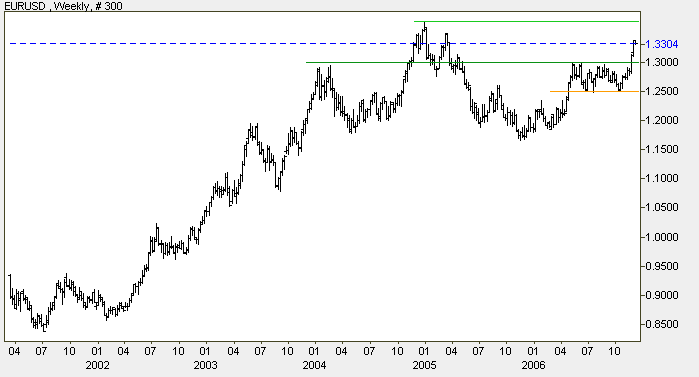
Currencies
The euro is rapidly strengthening against the dollar. A
pull-back to test the new support level at $1.30 remains
likely.
Source: Netdania
Medium Term: Expect some resistance at $1.35, but the
rally is likely to test the early 2005 high of $1.37.
Long Term: A break above $1.37 would signal that the long-term up-trend has resumed.
Long Term: A break above $1.37 would signal that the long-term up-trend has resumed.
Treasury yields
The 10-year yield is falling rapidly, having penetrated support
at 4.60% and the long-term trendline.
Medium Term: Falling long-term yields often anticipate a decline in short-term yields. And falling short-term yields normally signal an economic slow-down.
The yield differential (10-year T-notes minus 13-week T-bills) continues its down-trend below zero, increasing the risk of a sharp down-turn.
Medium Term: Falling long-term yields often anticipate a decline in short-term yields. And falling short-term yields normally signal an economic slow-down.
The yield differential (10-year T-notes minus 13-week T-bills) continues its down-trend below zero, increasing the risk of a sharp down-turn.
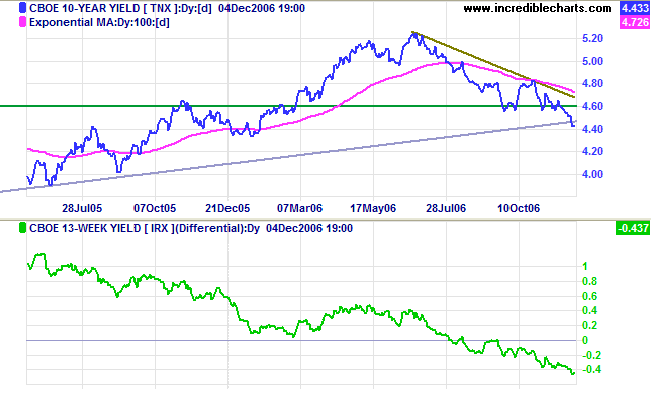
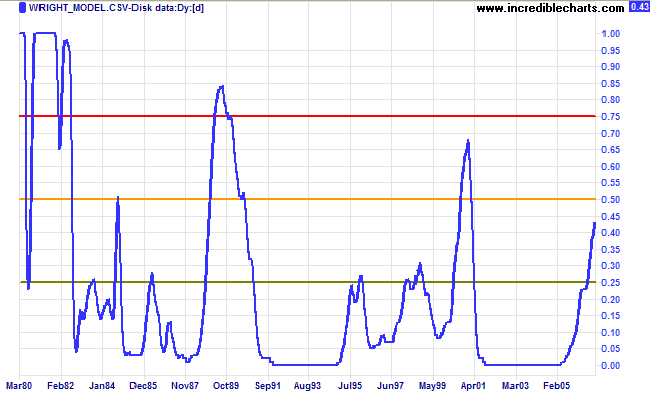
Long Term: Probability of recession in the next four
quarters remains at 43 per cent last week, according to
the Wright
Model. A rise above 50 per cent would be cause for concern.
Perfection is achieved, not when there is
nothing more to add,
but when there is nothing left to take away.
~ Antoine de Saint Exupery
but when there is nothing left to take away.
~ Antoine de Saint Exupery
Technical Analysis and PredictionsI believe that Technical Analysis should not be used to make predictions because we never know the outcome of a particular pattern or series of events with 100 per cent certainty. The best that we can hope to achieve is a probability of around 80 per cent for any particular outcome: something unexpected will occur at least one in five times.My approach is to assign probabilities to each possible outcome. Assigning actual percentages would imply a degree of precision which, most of the time, is unachievable. Terms used are more general: "this is a strong signal"; "this is likely"; "expect this to follow"; "this is less likely to occur"; "this is unlikely"; and so on. Bear in mind that there are times, especially when the market is in equilibrium, when we may face several scenarios with fairly even probabilities. Analysis is also separated into three time frames: short, medium and long-term. While one time frame may be clear, another could be uncertain. Obviously, we have the greatest chance of success when all three time frames are clear. The market is a dynamic system. I often compare trading to a military operation, not because of its' oppositional nature, but because of the complexity, the continual uncertainty created by conflicting intelligence and the element of chance that can disrupt even the best made plans. Prepare thoroughly, but allow for the unexpected. The formula is simple: trade when probabilities are in your favor; apply proper risk (money) management; and you will succeed. For further background, please read About The Trading Diary. |

Author: Colin Twiggs is a former investment banker with almost 40 years of experience in financial markets. He co-founded Incredible Charts and writes the popular Trading Diary and Patient Investor newsletters.
Using a top-down approach, Colin identifies key macro trends in the global economy before evaluating selected opportunities using a combination of fundamental and technical analysis.
Focusing on interest rates and financial market liquidity as primary drivers of the economic cycle, he warned of the 2008/2009 and 2020 bear markets well ahead of actual events.
He founded PVT Capital (AFSL No. 546090) in May 2023, which offers investment strategy and advice to wholesale clients.