Nikkei Bear Signal
By Colin Twiggs
November 25, 2006 5:30 p.m. AET (1:30 p.m. ET)
November 25, 2006 5:30 p.m. AET (1:30 p.m. ET)
These extracts from my daily trading diary are for educational
purposes and should not be interpreted as investment advice.
Full terms and conditions can be found at
Terms of Use. The next newsletter (an update on Gold, Crude
Oil and the Dollar) will be on Tuesday.
The Big Picture
The Dow was quiet this week due to
Thanksgiving holiday. The Transport index
is close to its previous high of 5000 and breakout above this
level would signal the start of a bull market. The FTSE 100 and Australian All Ords
show reasonable strength, but the Nikkei
is weakening rapidly.
Crude oil rallied to $59.24/barrel. Failure of key support at $55/barrel would signal a long-term down-trend. The dollar is weakening, breaking above $1.30 against the euro (the high of its 6 month's consolidation). Gold strengthened to $637.20 in response.
Probability of recession in the next four quarters increased to 43 per cent according to the Wright model. A climb above 50% would be cause for concern.
USA: Dow, NASDAQ & SP500
The Dow Industrial Average
consolidated on low volume due to the holiday. A rise above
12350 would signal resumption of the up-trend.
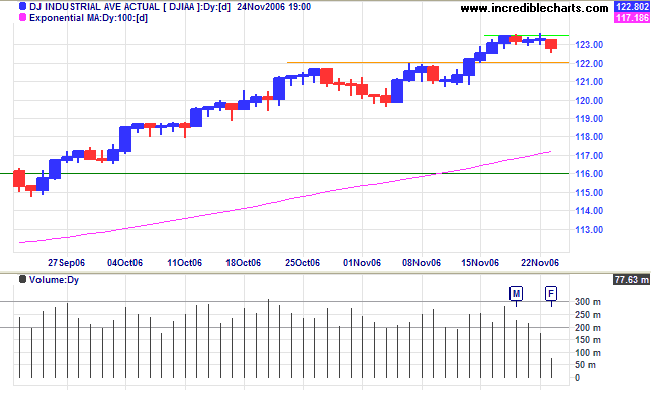
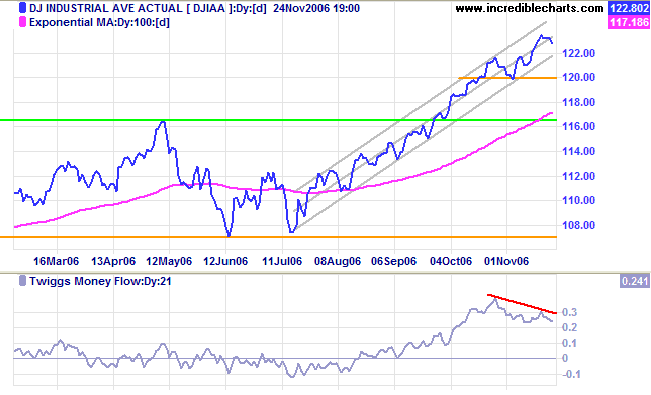
Medium Term: The last few month's rally has formed a
trend channel (drawn at 2 standard deviations around a linear
regression line). Acceleration above the upper channel would
warn of a possible spike, while breakout below would signal
that the up-trend is slowing, warning of a possible reversal. I
have revised the current target downwards to 12500 (calculated
as 11600 + {11600 - 10700}) after rounding values to the
nearest hundred.
Twiggs Money Flow (21-day) continues to show a bearish
divergence, warning of distribution.
Long Term: The Dow remains in a primary up-trend, with support at 10700.
Long Term: The Dow remains in a primary up-trend, with support at 10700.
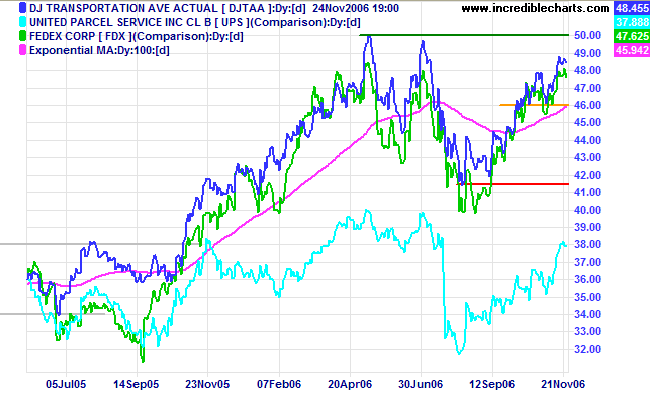
The Dow Jones Transportation Average is headed for a
test of resistance at the May high of 5000 (closely following
Fedex). Breakout above 5000 would confirm the existence of a
bull market.
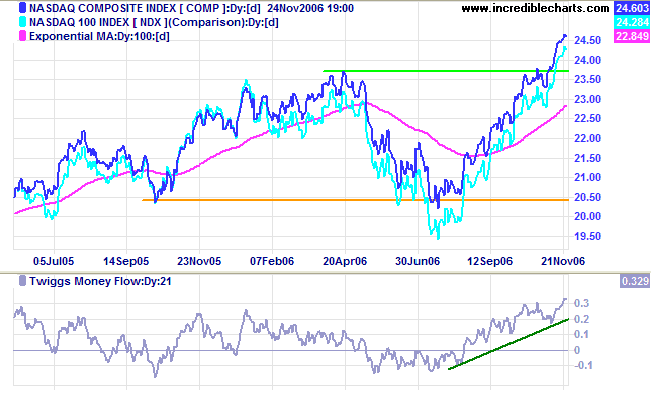
The Nasdaq Composite Index is rallying strongly above
its April high of 2370 and the Nasdaq 100 has followed
suit. A positive sign for the broader equity
market. Twiggs
Money Flow (21-day) trending upwards above zero signals
accumulation. A retracement to test the new support level of
2370 remains likely.
The S&P 500 had a quiet week with Thanksgiving
holiday.
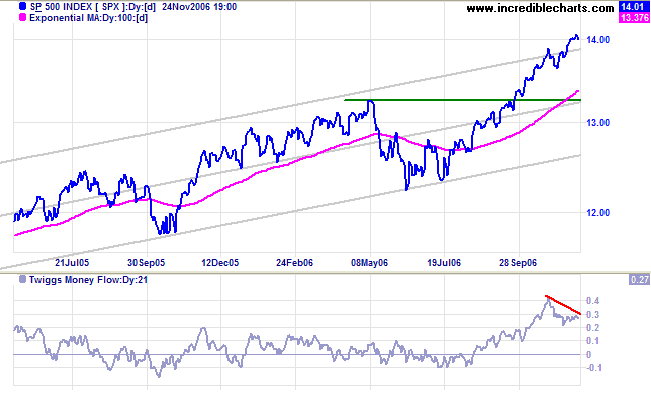
Medium Term: Breakout above the upper trend channel
(drawn at 2 standard deviations around a linear regression
line) signals that the slow long-term trend may be
accelerating, but bearish
divergence on
Twiggs Money Flow (21-day) warns of a reversal.
Long Term: The S&P 500 is in a primary up-trend, with support at 1220.
Long Term: The S&P 500 is in a primary up-trend, with support at 1220.
LSE: United Kingdom
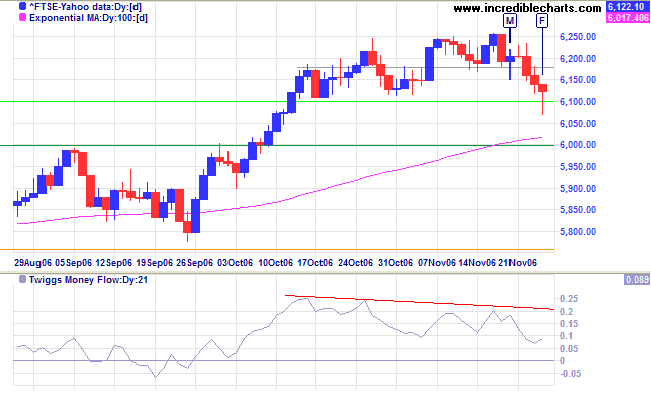
The FTSE 100 broke through last week's low to test
support at 6100 (from the April high). The
hammer candlestick on Friday shows strong buying support,
signaling a reversal. Look for a rally to test resistance at
6250.
Medium Term: Respect of support at 6100 would be a bullish signal that the primary up-trend is likely to resume. Twiggs Money Flow (21-day) displays a bearish triple divergence, so failure of support at 6100/6000, and a secondary correction, remain a possibility.
Long Term: The primary up-trend continues, with support at 5500.
Nikkei: Japan
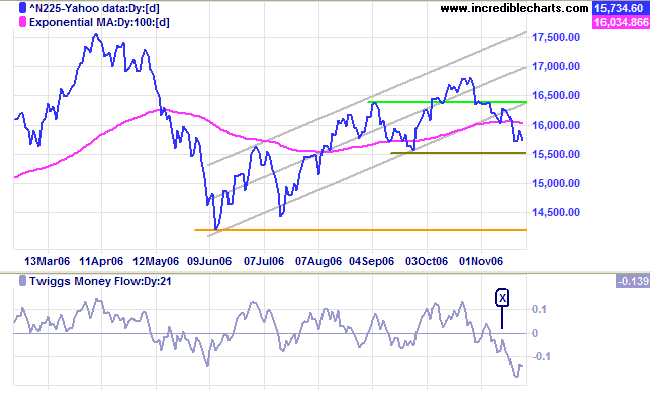
The Nikkei 225 broke below its 100-day moving
average and appears headed for a test of intermediate
support at 15500.
Medium Term: Twiggs Money Flow (21-day) displays a bearish peak [X] below the zero line, signaling strong distribution. Penetration of support at 15500 would warn of a test of primary support at 14200.
Long Term: The index is in a primary up-trend, but primary support may be weakened by failure of the index to test its previous high of 17500.
ASX: Australia
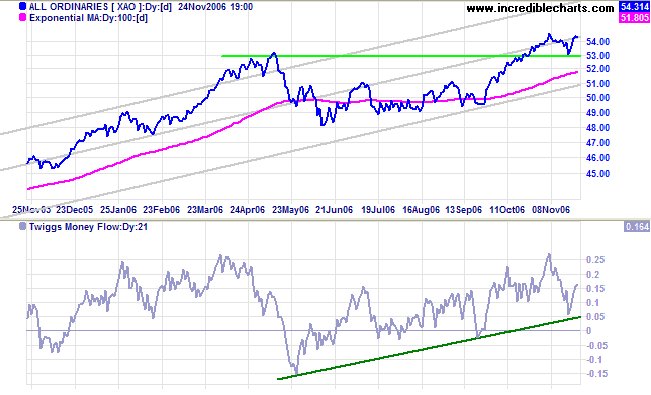
The All Ordinaries encountered resistance at 5450, but
Friday's long tail and large volume signal buying support. A
fall below Friday's low would signal another test of key
support at 5300 (from the May high), while a close above 5450
would mean the start of another rally. Exceptional volume over
the week indicates a clash between two opposing camps: buyers
and profit-takers. So far, buyers appear to have gained the
upper hand.
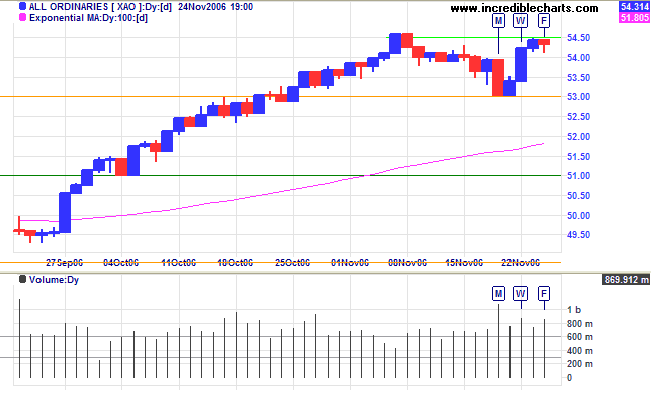
Medium Term: At the start of the week, the index
respected key support at 5300 -- signaling that a test of the
upper border of the trend channel (channel lines drawn at 2
standard deviations around a linear regression line) is likely.
Twiggs Money Flow (21-day) above zero and trending upwards
signals long-term accumulation.
Long Term: The All Ordinaries is in a primary up-trend with support at 4800.
Long Term: The All Ordinaries is in a primary up-trend with support at 4800.
I have known war as few men now living know
it.
It's very destructiveness on both friend and foe has rendered it useless
as a means of settling international disputes.
~ General Douglas MacArthur
It's very destructiveness on both friend and foe has rendered it useless
as a means of settling international disputes.
~ General Douglas MacArthur
|
Technical Analysis and Predictions I believe that Technical Analysis should not be used to make predictions because we never know the outcome of a particular pattern or series of events with 100 per cent certainty. The best that we can hope to achieve is a probability of around 80 per cent for any particular outcome: something unexpected will occur at least one in five times. My approach is to assign probabilities to each possible outcome. Assigning actual percentages would imply a degree of precision which, most of the time, is unachievable. Terms used are more general: "this is a strong signal"; "this is likely"; "expect this to follow"; "this is less likely to occur"; "this is unlikely"; and so on. Bear in mind that there are times, especially when the market is in equilibrium, when we may face several scenarios with fairly even probabilities. Analysis is also separated into three time frames: short, medium and long-term. While one time frame may be clear, another could be uncertain. Obviously, we have the greatest chance of success when all three time frames are clear. The market is a dynamic system. I often compare trading to a military operation, not because of its' oppositional nature, but because of the complexity, the continual uncertainty created by conflicting intelligence and the element of chance that can disrupt even the best made plans. Prepare thoroughly, but allow for the unexpected. The formula is simple: trade when probabilities are in your favor; apply proper risk (money) management; and you will succeed. For further background, please read About The Trading Diary. |

Author: Colin Twiggs is a former investment banker with almost 40 years of experience in financial markets. He co-founded Incredible Charts and writes the popular Trading Diary and Patient Investor newsletters.
Using a top-down approach, Colin identifies key macro trends in the global economy before evaluating selected opportunities using a combination of fundamental and technical analysis.
Focusing on interest rates and financial market liquidity as primary drivers of the economic cycle, he warned of the 2008/2009 and 2020 bear markets well ahead of actual events.
He founded PVT Capital (AFSL No. 546090) in May 2023, which offers investment strategy and advice to wholesale clients.