Gold , Oil & The Dollar
By Colin Twiggs
November 7, 2006 6:30 p.m. AEDT (2:30 a.m. ET)
November 7, 2006 6:30 p.m. AEDT (2:30 a.m. ET)
These extracts from my daily trading diary are for educational
purposes and should not be interpreted as investment advice.
Full terms and conditions can be found at
Terms of Use. The next newsletter (an update on Stocks
& Indexes) will be on Saturday.
Gold
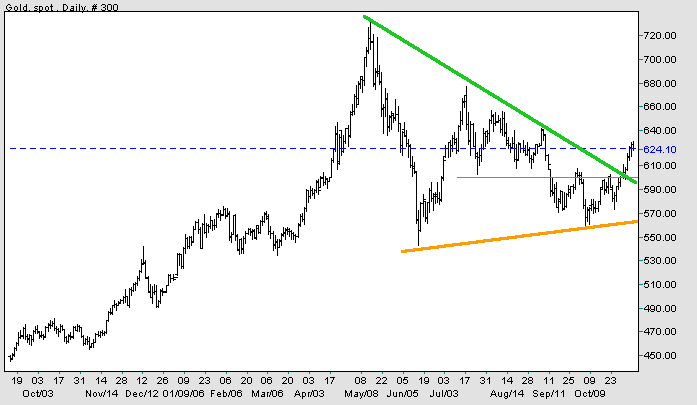
Spot gold rallied strongly since breaking through resistance at
$600. There has been no retracement, so far, to test the new
support level, but this remains a likely possibility.
Source: Netdania
Medium Term: Breakout from the upper border of the large
symmetrical triangle is a bullish sign. The target is
calculated as $790 : (600 + {730 - 540}), but resistance at the
previous high makes $730 a more conservative objective.
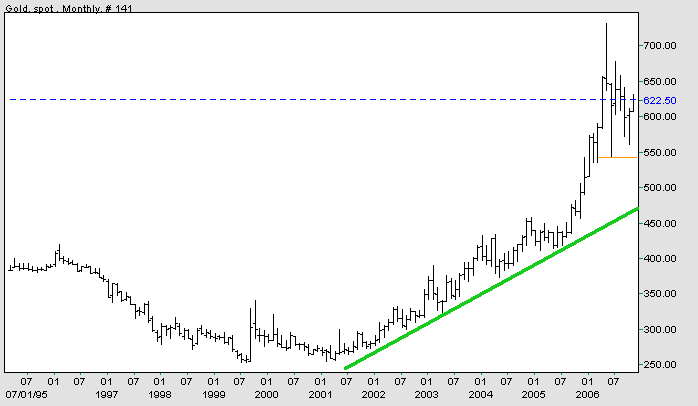
Long Term: Gold is in a primary up-trend with support at $540. If oil prices continue to weaken, the present pattern may evolve into a stage 3 top, followed by a test of the long-term supporting trendline.
Long Term: Gold is in a primary up-trend with support at $540. If oil prices continue to weaken, the present pattern may evolve into a stage 3 top, followed by a test of the long-term supporting trendline.
Source: Netdania
Crude Oil
December Light Crude respected resistance at $62 while troughs
edged progressively lower (at $59, $58 and then $57). The
pattern is rather untidy, but recognizable as a right-angled descending broadening formation.
Breakouts may occur in either direction and are a reliable
indicator of future trend direction. A
failure swing would give early indication of likely
breakout direction: watch for a higher trough or a lower
peak.
Medium Term: Expect strong support at $55.
Medium Term: Expect strong support at $55.
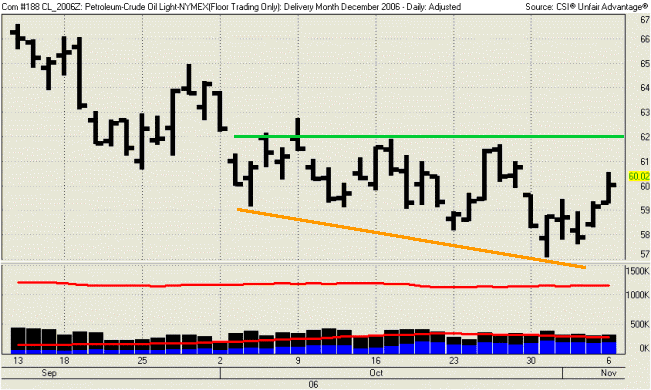
Long Term: Retracement from $80 to $55 may merely
establish the base for continuation of the larger up-trend, but
this could take time to emerge.
Currencies
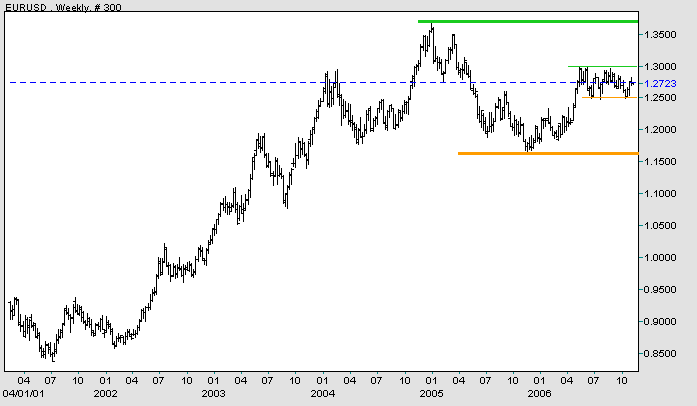
The euro encountered short-term resistance at $1.280. A
brief retracement or consolidation below this level would be a
bullish sign.
Medium Term: Consolidation of the last 6 months is bounded by support at $1.25 and resistance at $1.30. Expect the current rally to test $1.30, but direction of any future breakout remains uncertain.
Long Term: Upward breakout (from the consolidation) would test the previous high of $1.37, while a downward breakout would test primary support at $1.165, threatening to complete a large head and shoulders reversal.
Source: Netdania
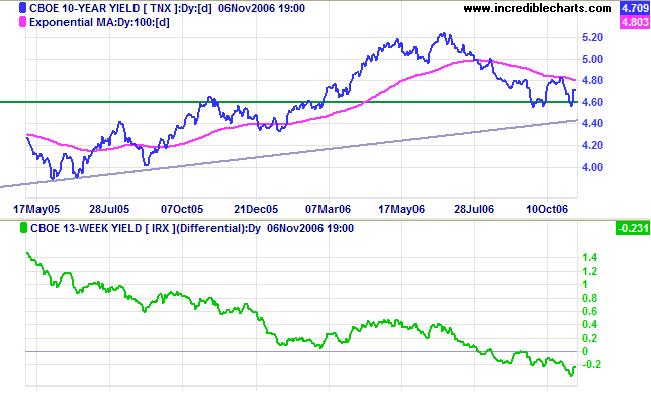
Treasury yields
The 10-year yield respected support at 4.60%, but remains in
bear territory below its 100-day moving
average.
Medium Term: Breakout above the recent high of 4.80% would complete a small double bottom with a target of 5.00%. Failure of support and a break of the long-term trendline, on the other hand, would signal long-term weakness.
The yield differential (10-year T-notes minus 13-week T-bills) continues its down-trend below zero, increasing the risk of an economic slow-down.
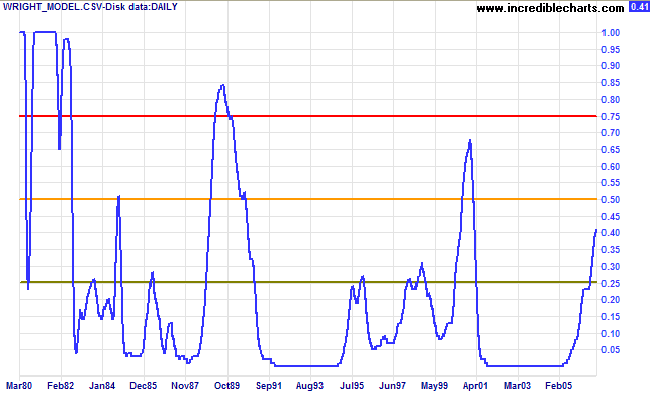
Long Term: Probability of recession in the next
four quarters increased to 41 per cent according to the
Wright
Model. A rise above 50 per cent would be cause for
concern.
What follows is ever closely linked to what
precedes;
it is not a procession of isolated events, merely obeying the laws of sequence, but a rational continuity.
Moreover, just as the things already in existence are all harmoniously coordinated,
things in the act of coming into existence exhibit the same marvel of concatenation,
rather than simply the bare fact of succession.
~ Marcus Aurelius
Technical Analysis and PredictionsI believe that Technical Analysis should not be used to make predictions because we never know the outcome of a particular pattern or series of events with 100 per cent certainty. The best that we can hope to achieve is a probability of around 80 per cent for any particular outcome: something unexpected will occur at least one in five times.My approach is to assign probabilities to each possible outcome. Assigning actual percentages would imply a degree of precision which, most of the time, is unachievable. Terms used are more general: "this is a strong signal"; "this is likely"; "expect this to follow"; "this is less likely to occur"; "this is unlikely"; and so on. Bear in mind that there are times, especially when the market is in equilibrium, when we may face several scenarios with fairly even probabilities. Analysis is also separated into three time frames: short, medium and long-term. While one time frame may be clear, another could be uncertain. Obviously, we have the greatest chance of success when all three time frames are clear. The market is a dynamic system. I often compare trading to a military operation, not because of its' oppositional nature, but because of the complexity, the continual uncertainty created by conflicting intelligence and the element of chance that can disrupt even the best made plans. Prepare thoroughly, but allow for the unexpected. The formula is simple: trade when probabilities are in your favor; apply proper risk (money) management; and you will succeed. For further background, please read About The Trading Diary. |

Author: Colin Twiggs is a former investment banker with almost 40 years of experience in financial markets. He co-founded Incredible Charts and writes the popular Trading Diary and Patient Investor newsletters.
Using a top-down approach, Colin identifies key macro trends in the global economy before evaluating selected opportunities using a combination of fundamental and technical analysis.
Focusing on interest rates and financial market liquidity as primary drivers of the economic cycle, he warned of the 2008/2009 and 2020 bear markets well ahead of actual events.
He founded PVT Capital (AFSL No. 546090) in May 2023, which offers investment strategy and advice to wholesale clients.