Stocks & Indexes
By Colin Twiggs
October 28, 2006 0:30 a.m. ET (2:30 p.m. AET)
October 28, 2006 0:30 a.m. ET (2:30 p.m. AET)
These extracts from my daily trading diary are for educational
purposes and should not be interpreted as investment advice.
Full terms and conditions can be found at
Terms of Use. The next newsletter (an update on Gold, Crude
Oil and the Dollar) will be on Tuesday.
The Big Picture
The Dow is trending upwards and we await a
new high on the Dow Transportation Average
to confirm that we are in a bull market.
Crude oil recovered to above $60/barrel and the dollar weakened on the back of low GDP growth figures, headed for a test of $1.30 against the euro. Gold strengthened as a result, testing $600. The short retracement below resistance at $600 is a bullish sign -- watch for a breakout and confirmation -- from a narrow consolidation or short retracement that respects the new support level.
Probability of recession in the next four quarters increased to 40 per cent, according to the Wright model. A climb above 50% would be cause for concern.
USA - Dow, NASDAQ & SP500
The Dow Industrial Average overcame
resistance at 12000 on Monday [M], but now appears headed for a
test of the new support level. Respect of support at 12000
would be a strong bull signal, while failure would suggest
trend weakness.
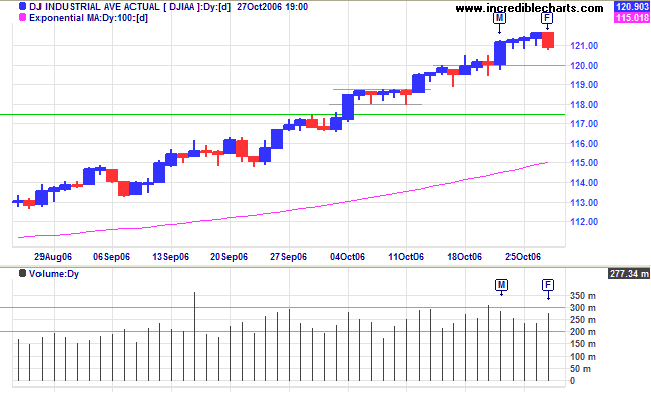
Medium Term: The index continues to hold well above its
100-day moving
average, signaling a strong up-trend, while
Twiggs Money Flow (13-week) respecting the zero line
indicates strong accumulation. Target for the breakout is 12700
(calculated as 11650 + {11650 - 10700}).
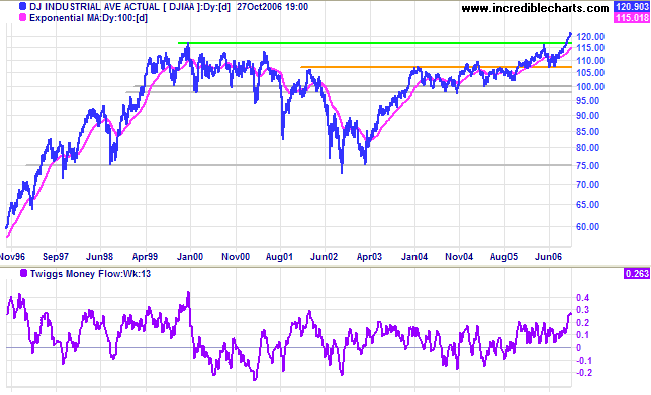
Long Term: The Dow is in a primary up-trend with support at 10700.
Long Term: The Dow is in a primary up-trend with support at 10700.
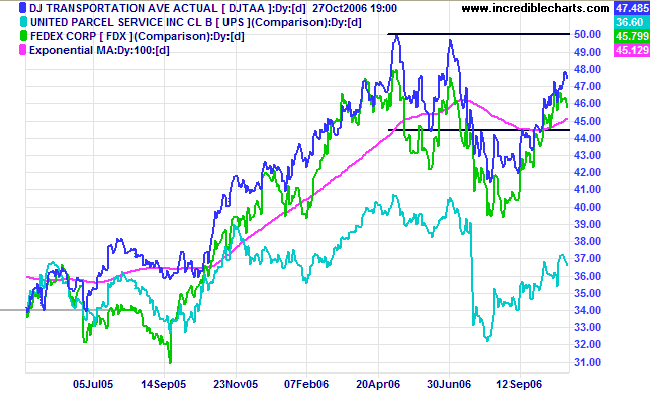
The Dow Jones Transportation Average is rallying
strongly, headed for a test of its May high. A break above 5000
would signal reversal to a primary up-trend and confirm the
existence of a
bull market.
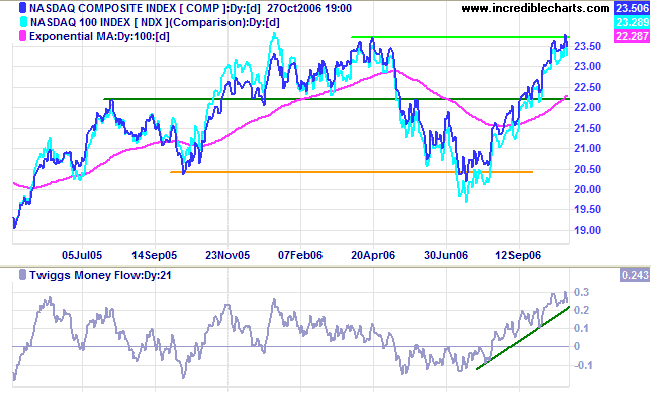
The Nasdaq Composite Index made a false break above its
April high of 2370 before reversing. Narrow consolidation or a
short retracement below the resistance level would be a bullish
sign. A fall below 2320, on the other hand, would signal
hesitancy. The index is well above its 100-day moving
average and
Twiggs Money Flow (21-day) signals strong
accumulation. Breakout above the April high would have a
target of 2720 (calculated as 2370 + {2370 - 2020}).
The recent spike in
Twiggs Money Flow (21-day) on the S&P 500 warns
of an accelerating up-trend and a possible breakout above the
linear regression channel.
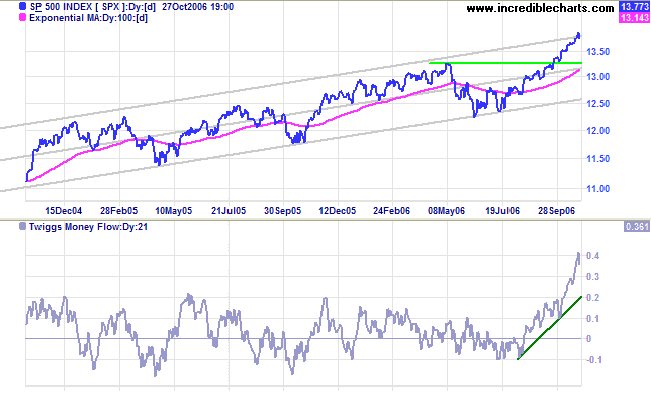
Medium Term: The target for the latest rally is still
some way off at 1425 (calculated as 1325 + {1325 - 1225}).
Reversal at the upper border of the linear regression channel,
however, would indicate that the present slow up-trend is
likely to continue.
Long Term: The S&P 500 is in a primary up-trend with support at 1220.
Long Term: The S&P 500 is in a primary up-trend with support at 1220.
LSE - United Kingdom
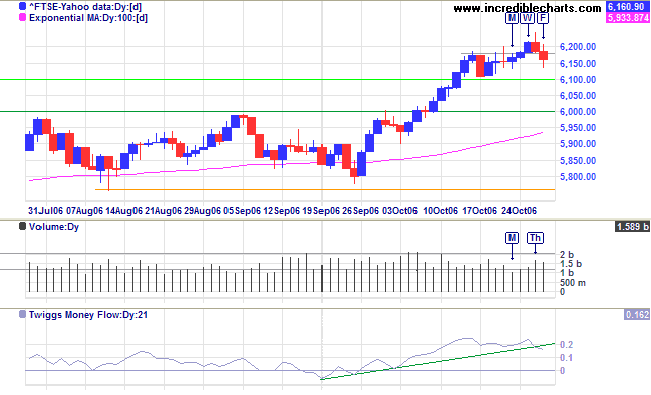
The FTSE 100 broke through short-term resistance on
Wednesday [W], but renewed selling signals hesitancy (note the
tall shadow and increased volume on [Th]). Respect of
support at 6100 would be a positive sign, while failure would
signal trend weakness.
Medium Term: Target for the breakout is 6700 (calculated as 6100 + {6100 - 5500}). Twiggs Money Flow (21-day) break of the upward trendline signals short-term weakness.
Long Term: The primary trend remains up, with support at 5500.
Medium Term: Target for the breakout is 6700 (calculated as 6100 + {6100 - 5500}). Twiggs Money Flow (21-day) break of the upward trendline signals short-term weakness.
Long Term: The primary trend remains up, with support at 5500.
Nikkei - Japan
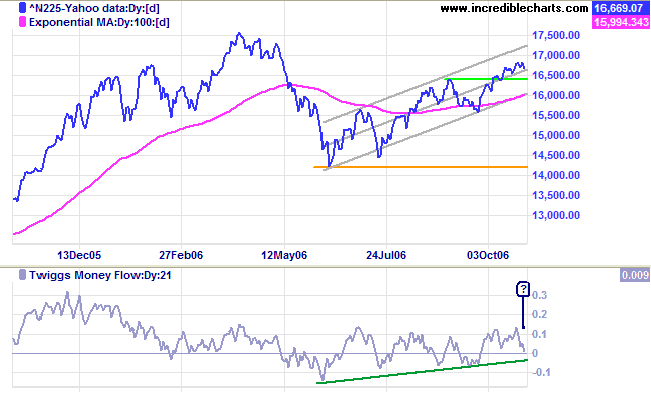
The Nikkei 225 is edging upwards, but there are no tall
blue candles reminiscent of past rallies: retracement to test
intermediate support at 16400 may be approaching. A break below
the central linear regression line would be a further
indication.
Medium Term: Twiggs Money Flow (21-day) is headed for a test of the zero line at [?]. A fall below zero would signal further hesitancy.
Long Term: The index continues in a primary up-trend with support at 14200.
Medium Term: Twiggs Money Flow (21-day) is headed for a test of the zero line at [?]. A fall below zero would signal further hesitancy.
Long Term: The index continues in a primary up-trend with support at 14200.
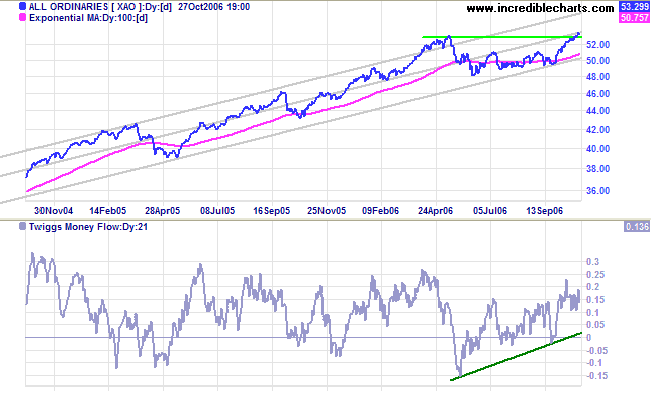
ASX - Australia
The All Ordinaries displays similar high volumes to last
week, indicating continued resistance in the band of 5300 to
5350 from the May high.
Narrow consolidation between 5300 and 5350 would be a
bullish sign, while reversal below 5300 would be bearish.
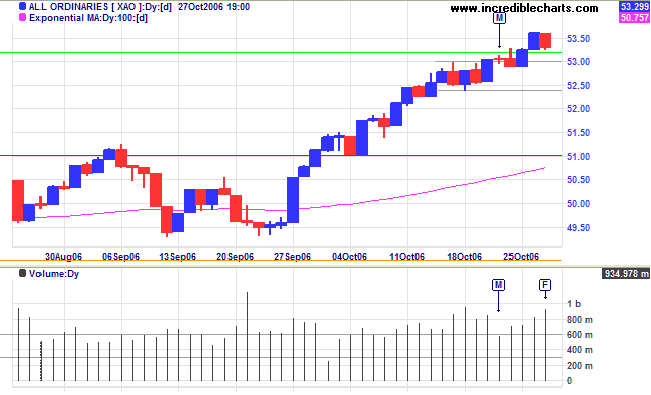
Medium Term: A breakout above 5350, followed by
retracement that respects the new support level, would signal a
test of the upper border of the regression channel. The target
is calculated as 5800 (5300 + {5300 - 4800}).
Twiggs Money Flow (21-day) trending upwards above the zero
line signals accumulation.
Long Term: The All Ordinaries continues in a primary up-trend with support at 4800.
Long Term: The All Ordinaries continues in a primary up-trend with support at 4800.
The early bird gets the worm, but the second
mouse gets the cheese.
~ Unknown
~ Unknown
|
Technical Analysis and Predictions I believe that Technical Analysis should not be used to make predictions because we never know the outcome of a particular pattern or series of events with 100 per cent certainty. The best that we can hope to achieve is a probability of around 80 per cent for any particular outcome: something unexpected will occur at least one in five times. My approach is to assign probabilities to each possible outcome. Assigning actual percentages would imply a degree of precision which, most of the time, is unachievable. Terms used are more general: "this is a strong signal"; "this is likely"; "expect this to follow"; "this is less likely to occur"; "this is unlikely"; and so on. Bear in mind that there are times, especially when the market is in equilibrium, when we may face several scenarios with fairly even probabilities. Analysis is also separated into three time frames: short, intermediate and long-term. While one time frame may be clear, another could be uncertain. Obviously, we have the greatest chance of success when all three time frames are clear. The market is a dynamic system. I often compare trading to a military operation, not because of its' oppositional nature, but because of the complexity, the continual uncertainty created by conflicting intelligence and the element of chance that can disrupt even the best made plans. Prepare thoroughly, but allow for the unexpected. The formula is simple: trade when probabilities are in your favor; apply proper risk (money) management; and you will succeed. For further background, please read About The Trading Diary. |

Author: Colin Twiggs is a former investment banker with almost 40 years of experience in financial markets. He co-founded Incredible Charts and writes the popular Trading Diary and Patient Investor newsletters.
Using a top-down approach, Colin identifies key macro trends in the global economy before evaluating selected opportunities using a combination of fundamental and technical analysis.
Focusing on interest rates and financial market liquidity as primary drivers of the economic cycle, he warned of the 2008/2009 and 2020 bear markets well ahead of actual events.
He founded PVT Capital (AFSL No. 546090) in May 2023, which offers investment strategy and advice to wholesale clients.