Dow Breakout
By Colin Twiggs
October 5, 2006 11:55 a.m. AET (9:55 p.m. ET)
October 5, 2006 11:55 a.m. AET (9:55 p.m. ET)
Occasionally we will issue an extra mid-week update when a
significant event occurs on one of the major indexes. Your
feedback
is greatly appreciated.
These extracts from my daily trading diary are for educational purposes and should not be interpreted as investment advice. Full terms and conditions can be found at Terms of Use.
These extracts from my daily trading diary are for educational purposes and should not be interpreted as investment advice. Full terms and conditions can be found at Terms of Use.
USA
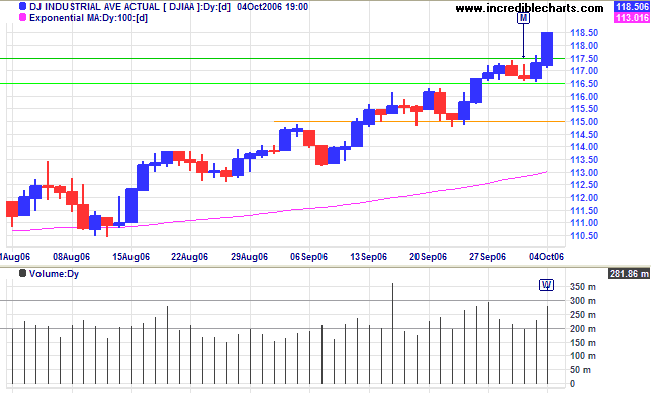
After a narrow consolidation below 11750, the Dow Jones Industrial Average broke through resistance to form a new all-time high at 11850 -- a strong bull signal. A retracement that respects the new support level (11750) would confirm the breakout.
After a narrow consolidation below 11750, the Dow Jones Industrial Average broke through resistance to form a new all-time high at 11850 -- a strong bull signal. A retracement that respects the new support level (11750) would confirm the breakout.
ASX Australia
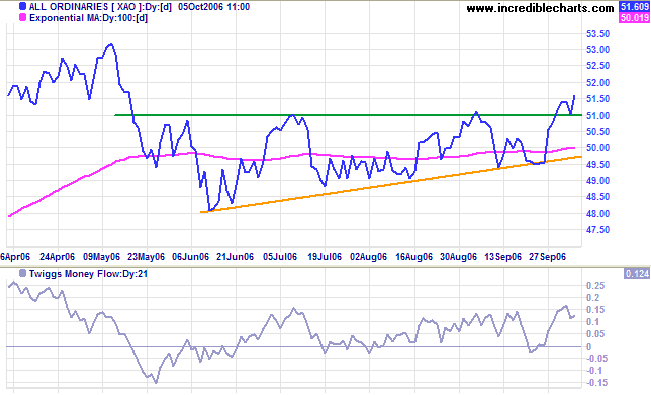
The All Ordinaries retraced to test support at 5100 before reversing strongly at the opening, confirming the breakout. Expect a test of resistance at the May high of 5320 and a possible new high. Twiggs Money Flow (21-day) signals accumulation.
The All Ordinaries retraced to test support at 5100 before reversing strongly at the opening, confirming the breakout. Expect a test of resistance at the May high of 5320 and a possible new high. Twiggs Money Flow (21-day) signals accumulation.
Gold
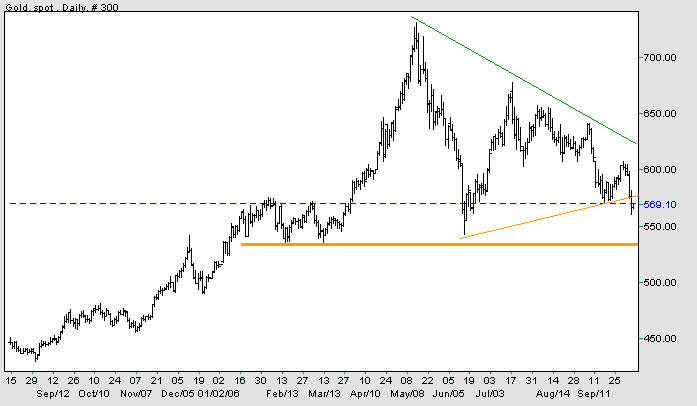
Gold has fallen out of bed, breaking out below a large symmetrical triangle, and is headed for a test of primary support at $540.
Gold has fallen out of bed, breaking out below a large symmetrical triangle, and is headed for a test of primary support at $540.
Source: Netdania
For more background information, read About
the Trading Diary.

Author: Colin Twiggs is a former investment banker with almost 40 years of experience in financial markets. He co-founded Incredible Charts and writes the popular Trading Diary and Patient Investor newsletters.
Using a top-down approach, Colin identifies key macro trends in the global economy before evaluating selected opportunities using a combination of fundamental and technical analysis.
Focusing on interest rates and financial market liquidity as primary drivers of the economic cycle, he warned of the 2008/2009 and 2020 bear markets well ahead of actual events.
He founded PVT Capital (AFSL No. 546090) in May 2023, which offers investment strategy and advice to wholesale clients.