Tuesday Update
September 19, 2006 4:30 p.m. AET
These extracts from my daily trading diary are for educational purposes and should not be interpreted as investment advice. Full terms and conditions can be found at Terms of Use.
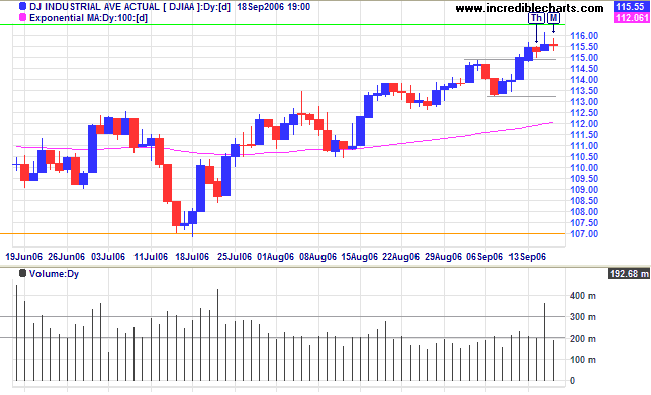
Apart from low volumes, the Dow Jones Industrial Average rally of the last two months appears sound, but its ability to break through major resistance at 11650/11750 remains questionable. Weak candles from Thursday [Th] to Monday [M] signal short-term hesitancy, but this could resolve in either direction. Intermediate support is at 11325/11300.

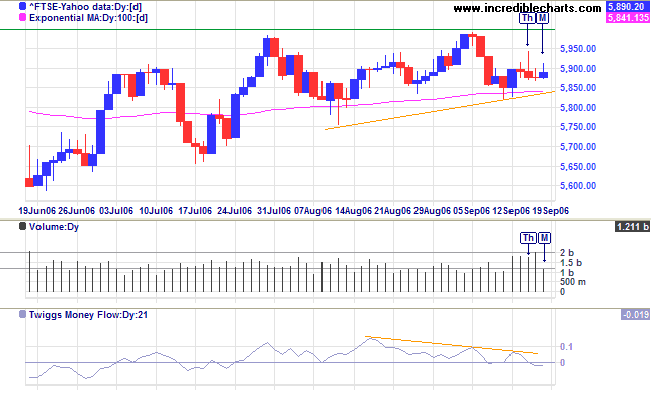
The FTSE 100 formed an ascending triangle below resistance at 6000. This is a bullish continuation pattern, but weak closes and increased volume over the last few days are a shorter-term bear signal that may disrupt the larger pattern. Twiggs Money Flow (21-day) has also descended below zero, signaling distribution.

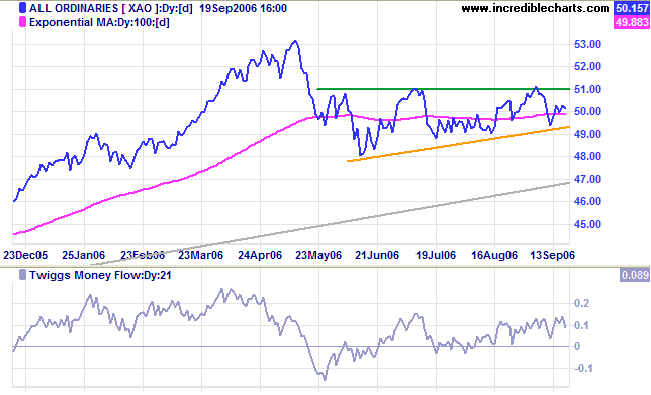
The latest dip on the All Ordinaries should validate the bullish ascending triangle, but it still has to overcome short-term resistance between 5030 and 5050. An upward breakout would test intermediate resistance at 5100, while reversal below 5000 would signal weakness and a possible re-test of the lower border -- a bearish sign. Twiggs Money Flow (21-day) has held above zero for more than a month so the bigger picture shows significant accumulation and favors a breakout above 5100.

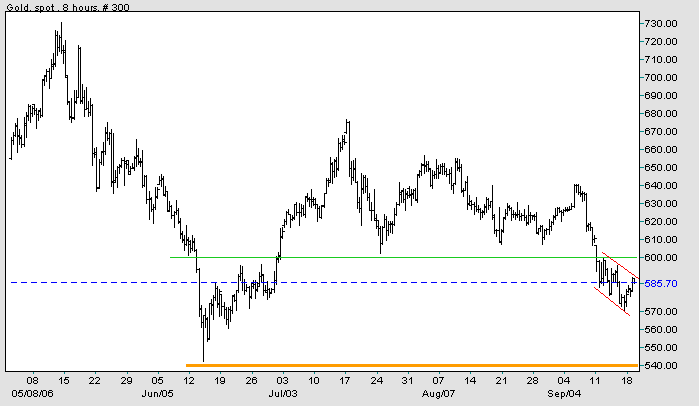
Gold formed a downward-sloping flag below $600. This is a continuation pattern and is likely to lead to a downward breakout towards primary support at $540. Failure of the flag pattern, on the other hand, would lead to a re-test of resistance at $600.


Author: Colin Twiggs is a former investment banker with almost 40 years of experience in financial markets. He co-founded Incredible Charts and writes the popular Trading Diary and Patient Investor newsletters.
Using a top-down approach, Colin identifies key macro trends in the global economy before evaluating selected opportunities using a combination of fundamental and technical analysis.
Focusing on interest rates and financial market liquidity as primary drivers of the economic cycle, he warned of the 2008/2009 and 2020 bear markets well ahead of actual events.
He founded PVT Capital (AFSL No. 546090) in May 2023, which offers investment strategy and advice to wholesale clients.
