Crude Oil Falls
By Colin Twiggs
September 8, 2006 3:27 a.m. ET (5:27 p.m. AET)
September 8, 2006 3:27 a.m. ET (5:27 p.m. AET)
These extracts from my daily trading diary are for educational
purposes and should not be interpreted as investment advice.
Full terms and conditions can be found at
Terms of Use.
The Big Picture
Low volumes on the recent rally and rising volume on the latest
retracement signal trend weakness on the Dow and S&P 500.
Next Friday is triple-witching
hour, when options and futures contracts on market indexes
expire in the last hour of trading, and could expose weaknesses
in the market.
The Dow Transport Index confirms general economic activity is declining, but strong increases in hourly wage data have raised fears of further rate hikes. The yield differential remains negative and is likely to cause problems in the months ahead.
Crude oil is falling sharply. Gold is likely to weaken and the dollar to strengthen.
USA
The Dow Industrial Average is retracing sharply and
appears headed for a test of intermediate support at 11250.
Failure of this level would signal a secondary correction that
may test primary support at 10700.
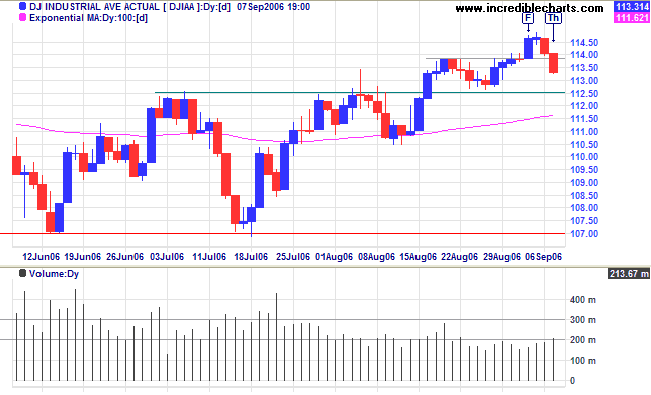
Medium Term: The index continues to present low volumes,
placing a question-mark over buyers' ability to break through
major resistance at 11650.
Twiggs Money Flow (21-day) reversed to zero, signaling
uncertainty.
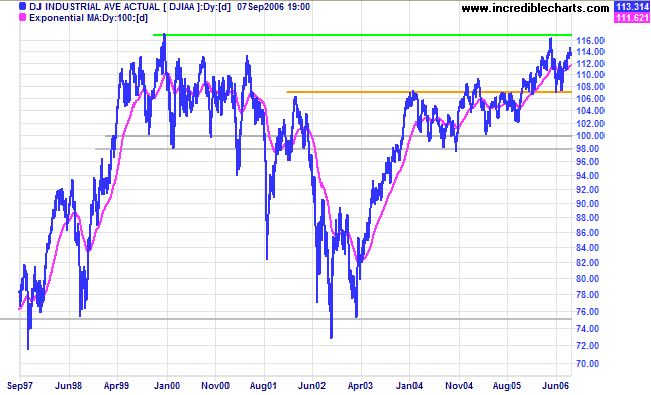
Long Term: The Dow continues in a primary up-trend, with resistance from the all-time high at 11650 and support at 10700.
Long Term: The Dow continues in a primary up-trend, with resistance from the all-time high at 11650 and support at 10700.
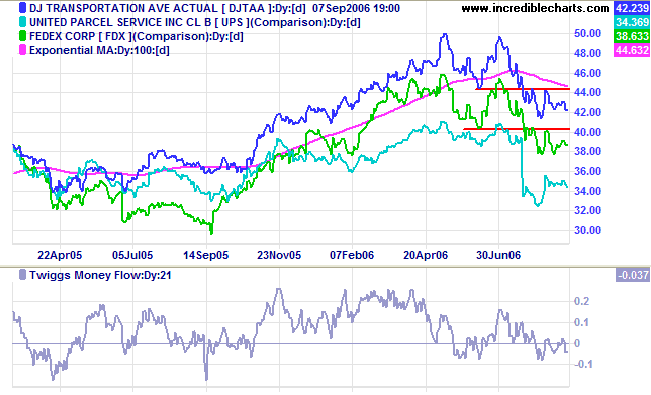
The Dow Jones Transportation Average and lead indicators
Fedex and UPS confirm that the economy is slowing -- all having
started primary down-trends.
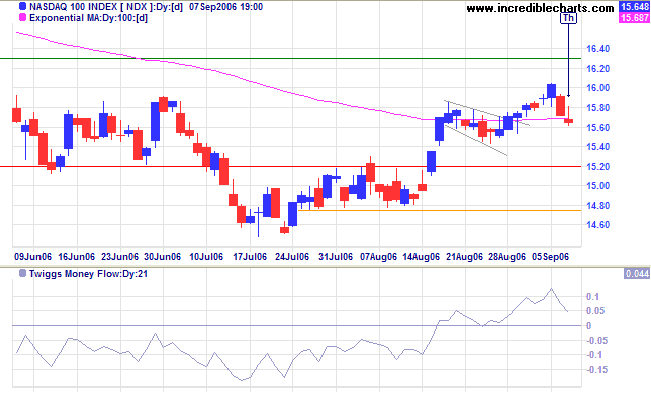
The Nasdaq 100 displays a bullish inverted hammer on
Thursday [Th]. An open above the body of the candle would
signal the start of another rally, with shorts protecting their
profits. A rise above 1580 would confirm -- and a
Twiggs Money Flow (21-day) trough above zero would be
another bullish sign. A fall below 1560 would signal failure --
and a test of intermediate support at 1540.
Rising volume on the latest S&P 500 retracement is a
bearish sign, especially after low volume during the last
rally. Expect a test of intermediate support at 1290. If that
fails, we could see a test of primary support at 1220. Respect
of 1290, on the other hand, would signal an attempt at the May
high of 1325.
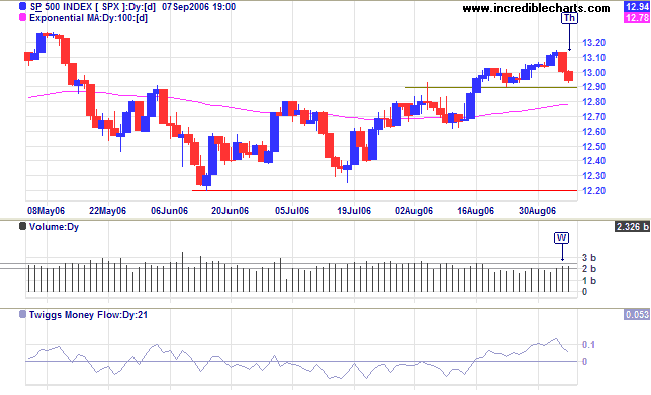
Medium Term: A
Twiggs Money Flow (21-day) trough above zero would be
bullish.
Long Term: The S&P 500 remains in a slow primary up-trend.
Long Term: The S&P 500 remains in a slow primary up-trend.
Treasury yields
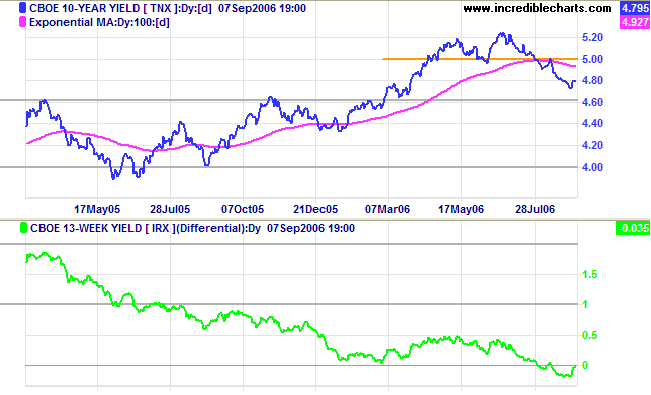
Strong rises in hourly wage data rekindled fears of further rate hikes, causing a retracement in the recent down-trend in 10-year Treasury note yields.
Medium Term: The yield differential (10-year T-notes minus 13-week T-bills) reversed towards zero (as short-term yields fell). The trend has not reversed and we can expect further weakness.
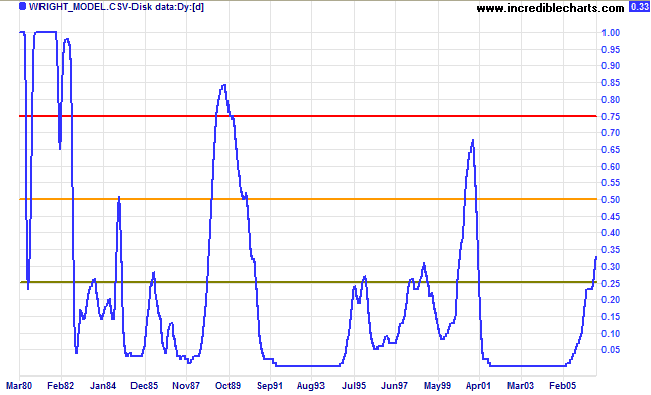
Long Term: Probability of recession in the next
four quarters increased to 33 per cent, according to the
Wright
Model (developed by Fed economist Jonathan H Wright).
According to the model, negative yield differentials and
increases in the fed funds rate raise the likelihood of a
recession. A spike that reaches 50% would warn of a stronger
down-turn than the "soft-landing" most investors hope for.
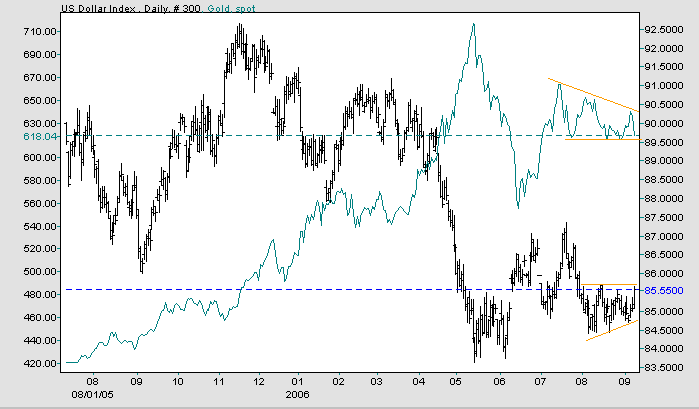
Gold
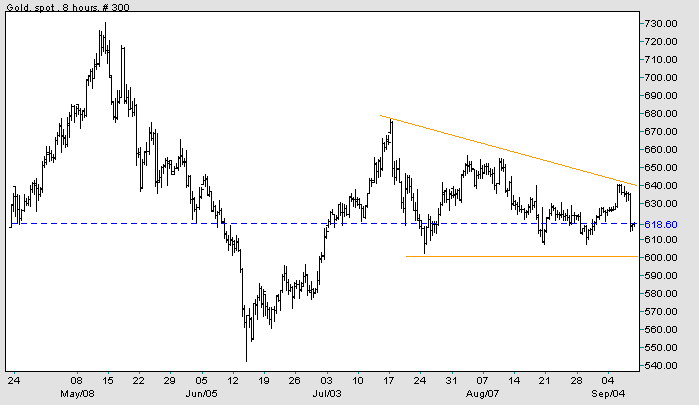
Spot gold formed a bearish descending triangle with support at $600. A downward breakout would signal a test of primary support at $540.
Medium Term: Falling crude oil prices should weaken gold and strengthen the dollar.
Long Term: The primary trend is upward, but remains weak.
Spot gold formed a bearish descending triangle with support at $600. A downward breakout would signal a test of primary support at $540.
Medium Term: Falling crude oil prices should weaken gold and strengthen the dollar.
Long Term: The primary trend is upward, but remains weak.
Source: Netdania
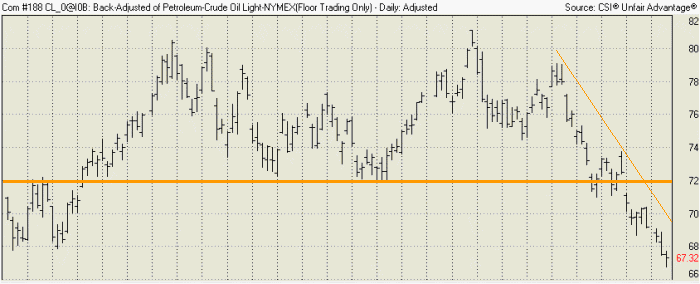
Crude Oil
Light Crude is in a strong down-trend after breaking through support at $72. The next major support level is at $59/$60, but do not rule out a retracement to test the new resistance level (at $72).
Light Crude is in a strong down-trend after breaking through support at $72. The next major support level is at $59/$60, but do not rule out a retracement to test the new resistance level (at $72).
Currencies
The US Dollar Index formed an ascending triangle in the last few weeks, mirroring the descending triangle on the gold chart. An upward breakout would signal an attempt at 87.00. Though less likely, a fall below 84.50 would warn of a test of major support at 83.50 (and a bullish sign for gold).
The US Dollar Index formed an ascending triangle in the last few weeks, mirroring the descending triangle on the gold chart. An upward breakout would signal an attempt at 87.00. Though less likely, a fall below 84.50 would warn of a test of major support at 83.50 (and a bullish sign for gold).
Source: Netdania
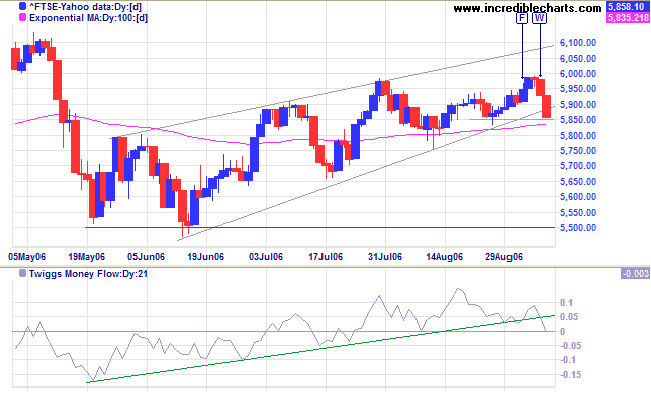
United Kingdom
The FTSE 100 made a downward breakout from a bearish rising wedge -- confirmed if intermediate support at 5850 fails. Watch for a test of primary support at 5500.
Medium Term: Twiggs Money Flow (21-day) is bearish after a sharp fall.
Long Term: The primary up-trend continues until primary support at 5500 is penetrated.
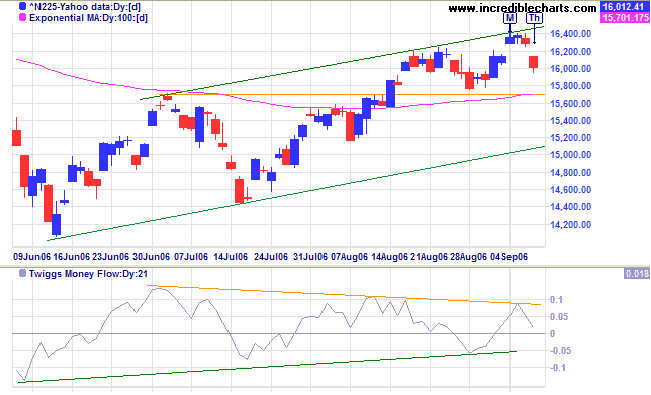
Japan
The Nikkei 225 is headed for a second test of the new support level at 15700.
Medium Term: The intermediate rally is likely to test resistance at the April high of 17500. Twiggs Money Flow (21-day) formed a narrow triangle around the zero line, indicating continued uncertainty.
Long Term: The primary up-trend is up.
ASX Australia
The All Ordinaries made a false break through resistance at 5100, reversing on the day following the breakout. Long tails in the last two days indicate buying at the first line of support -- a bullish sign. If support at 5050 holds, expect another breakout.
The All Ordinaries made a false break through resistance at 5100, reversing on the day following the breakout. Long tails in the last two days indicate buying at the first line of support -- a bullish sign. If support at 5050 holds, expect another breakout.
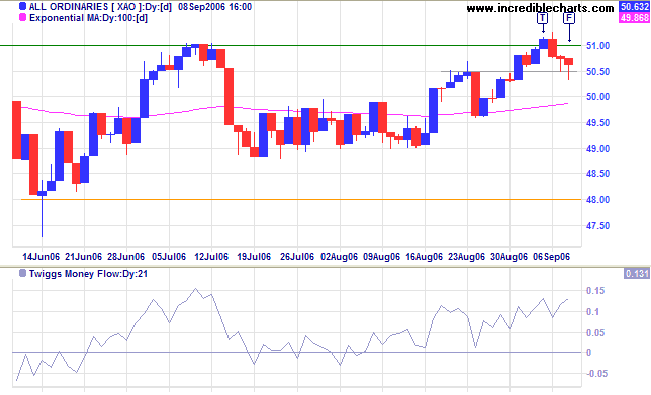
Medium Term: Another breakout above 5100 would signal a
test of the May high of 5300. Failure of intermediate support
at 4950 appears less likely, but would signal a test of primary
support at 4800.
Twiggs Money Flow (21-day) is rising, signaling
accumulation.
Long Term: The All Ordinaries continues in a primary up-trend.
Long Term: The All Ordinaries continues in a primary up-trend.
Discipline is being able to recognize that
even though the setups
are skewed toward moving in a given direction more times than not,
there are times when they are not going to move.
~ Don Miller
are skewed toward moving in a given direction more times than not,
there are times when they are not going to move.
~ Don Miller
For more background information, read About
the Trading Diary.

Author: Colin Twiggs is a former investment banker with almost 40 years of experience in financial markets. He co-founded Incredible Charts and writes the popular Trading Diary and Patient Investor newsletters.
Using a top-down approach, Colin identifies key macro trends in the global economy before evaluating selected opportunities using a combination of fundamental and technical analysis.
Focusing on interest rates and financial market liquidity as primary drivers of the economic cycle, he warned of the 2008/2009 and 2020 bear markets well ahead of actual events.
He founded PVT Capital (AFSL No. 546090) in May 2023, which offers investment strategy and advice to wholesale clients.