Markets Slow As Crude Finds Support
By Colin Twiggs
August 24, 2006 22:37 p.m. ET
August 24, 2006 22:37 p.m. ET
These extracts from my daily trading diary are for educational
purposes and should not be interpreted as investment advice.
Full terms and conditions can be found at
Terms of Use.
The Big Picture
Equity markets are holding on to recent gains, but low volumes
signal uncertainty and the Dow Transport
Index indicates a decline in general economic activity. A
slump in the housing market, as indicated by the fall in July
sales, would add further downward pressure.
The negative yield differential may cause problems in the months ahead.
Crude oil prices are finding support at $71/$72. Along with a weaker dollar, this may spur gold prices.
The negative yield differential may cause problems in the months ahead.
Crude oil prices are finding support at $71/$72. Along with a weaker dollar, this may spur gold prices.
USA
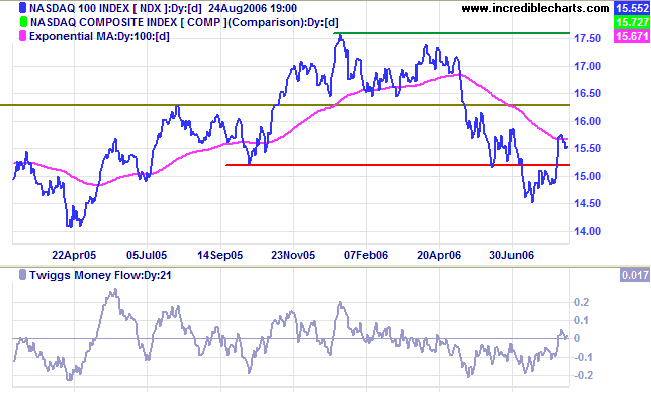
If the pull-back on the Nasdaq 100 respects the new
support level at 1520, then we have confirmation that the index
is in an up-trend and may test the recent high of 1760. Failure
of support, on the other hand, would be a strong bear signal.
Twiggs Money Flow (21-day) edged above zero, but future
direction is unclear.
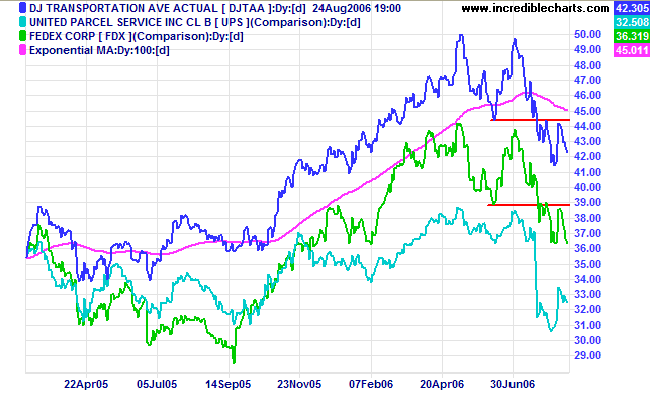
The Dow Jones Transportation Average failed to break out
above 4450, respecting resistance and confirming the
down-trend. Lead indicators Fedex and UPS display similar
weakness.
The Dow Industrial Average pulled back to test support
at 11300/11250. Low volumes indicate a lack of serious interest
from buyers and sellers and we may see consolidation above the
support level.
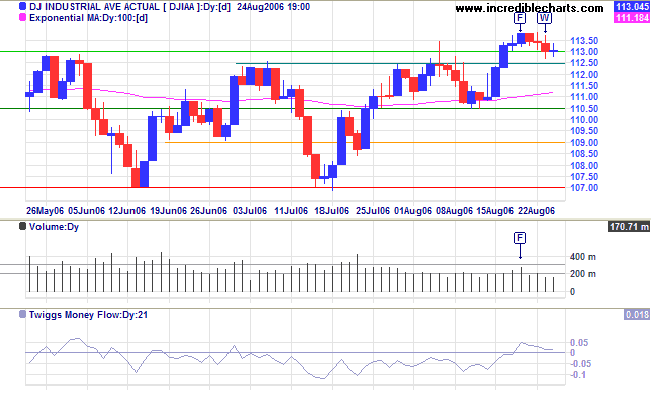
Medium Term: The target for the recent breakout is close
to the recent high of 11650: 11250 + (11250 - 10700) = 11700.
Twiggs Money Flow (21-day) is rising, signaling
accumulation.
Long Term: The Dow continues in a primary up-trend, with support at 10700.
Long Term: The Dow continues in a primary up-trend, with support at 10700.
Low volumes on the S&P 500 indicate uncertainty and
we could see a narrow consolidation above 1290 until buyers or
sellers regain interest.
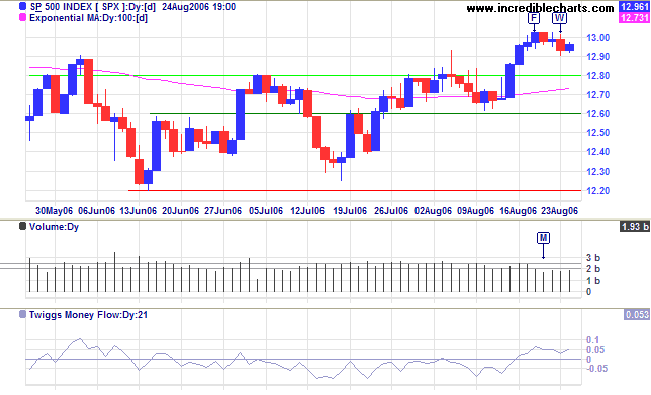
Medium Term: The index completed an
ascending triangle with the breakout above 1280, with a
target close to the recent high of 1330: 1280 + (1280 - 1220) =
1340.
Twiggs Money Flow (21-day) is rising, signaling
accumulation.
Long Term: The S&P 500 is in a slow up-trend, with primary support at 1220.
Long Term: The S&P 500 is in a slow up-trend, with primary support at 1220.
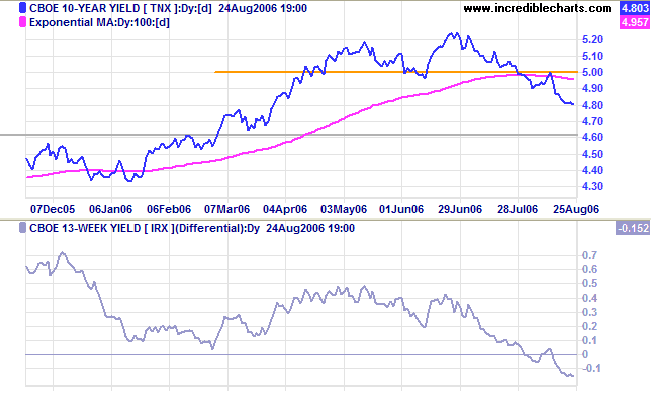
Treasury yields
The yield on 10-year Treasury notes is trending lower after respecting resistance at 5.0%.
Medium Term: There is still some concern over annual inflation, but July figures indicate that pressures may be easing -- relieving upward pressure on long-term yields.
Long Term: The yield differential (10-year T-notes minus 13-week T-bills) is negative and falling, increasing the risk of a down-turn.
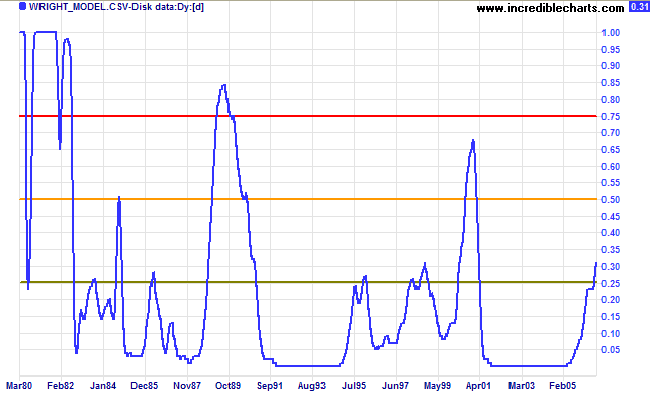
Probability of recession in the next four quarters increased to
31 per cent, according to the Wright
Model (developed by Fed economist Jonathan H Wright). We
will be able to gauge the Fed's ability to arrange a "soft
landing" for the economy over the next few months. The last
time the Fed succeeded was the modest spike in 1994; a spike
that reaches 50% would warn of a stronger down-turn.
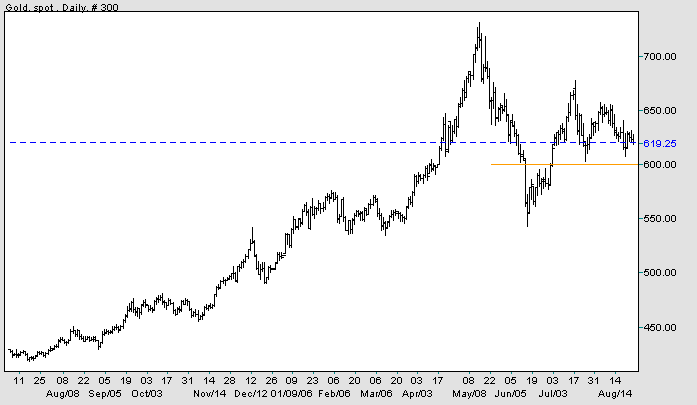
Gold
Spot gold is testing support at $600. A rally on the crude oil chart would strengthen gold prices.
Medium Term: The metal has broken out below a large symmetrical triangle. Penetration of support at $600 would signal another down-trend, with a target of $450: (630 - (730 - 550)), below primary support at $540/$550.
Long Term: The primary up-trend appears uncertain.
Source: Netdania
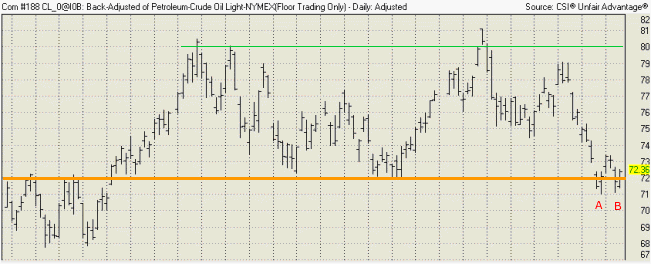
Crude Oil
After two false breaks below primary support at $72.00, Light Crude could rally if it completes a double bottom with a rise above $73.50. A fall below $71, however, would confirm the down-trend.
After two false breaks below primary support at $72.00, Light Crude could rally if it completes a double bottom with a rise above $73.50. A fall below $71, however, would confirm the down-trend.
Currencies
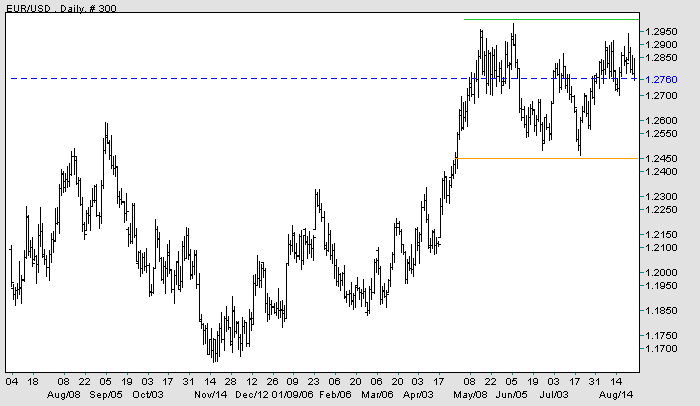
Slower growth and falling long-term bond yields should weaken the dollar.
The Euro is trending upwards, headed for another test of resistance at 1.30 dollars. A rise above this level would mean a test of the high at 1.35/1.36 (and a bullish sign for gold).
Slower growth and falling long-term bond yields should weaken the dollar.
The Euro is trending upwards, headed for another test of resistance at 1.30 dollars. A rise above this level would mean a test of the high at 1.35/1.36 (and a bullish sign for gold).
Source: Netdania
United Kingdom
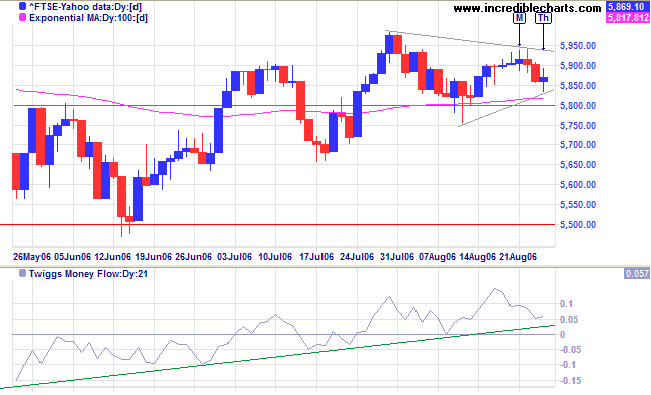
The FTSE 100 formed a small triangle, with future direction signaled by the breakout: either above 5950 or below 5850.
Medium Term: The intermediate trend is upwards, indicating that a test of resistance at 6130 is more likely than another test of primary support at 5500. Twiggs Money Flow (21-day) is trending upwards, signaling accumulation.
Long Term: The primary up-trend continues.
Japan
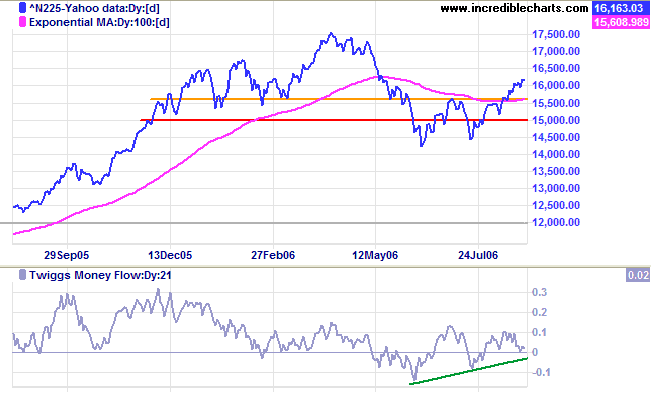
The Nikkei 225 is consolidating between 15900 and 16200, a bullish sign, after breaking out above an ascending triangle.
Medium Term: We may see a pull-back to test the new support level at 15700. Twiggs Money Flow (21-day) is rising, signaling accumulation.
Long Term: The index has reversed to a primary up-trend.
ASX Australia
The All Ordinaries fell back sharply through the new support level at 5000 on strong volume, with weak closes on Monday [M] and Wednesday [W] warning of resistance. Expect some support at 4900, but the breakout reversal is likely to elicit a strong bear reaction -- and a test of primary support at 4800. Twiggs Money Flow (21-day) is close to zero, signaling uncertainty.
The All Ordinaries fell back sharply through the new support level at 5000 on strong volume, with weak closes on Monday [M] and Wednesday [W] warning of resistance. Expect some support at 4900, but the breakout reversal is likely to elicit a strong bear reaction -- and a test of primary support at 4800. Twiggs Money Flow (21-day) is close to zero, signaling uncertainty.
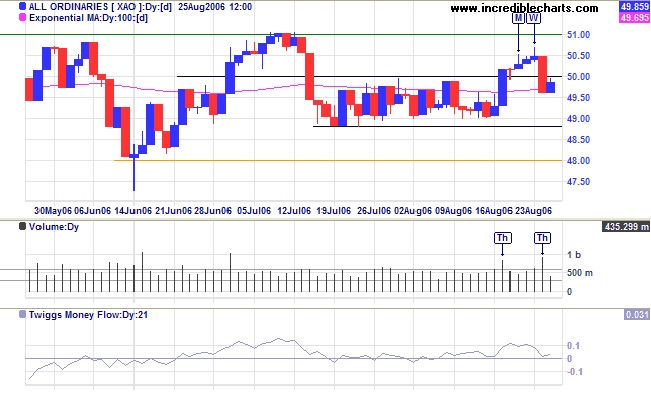
Medium Term: The index continues to oscillate in a
narrow channel around the linear regression line. Reversal to
above 5000 would signal another attempt to test the upper
border of the channel; confirmed if price rises above 5100.
Twiggs Money Flow (21-day) is rising, signaling
accumulation.
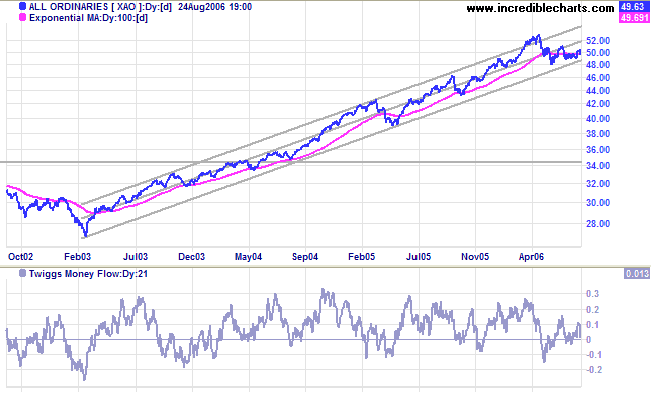
Long Term: The All Ordinaries is in a primary up-trend,
with support at 4800.
When one door closes, another opens:
but we often look so long and so regretfully upon the closed door
that we do not see the one which has opened for us.
~ Alexander Graham Bell
but we often look so long and so regretfully upon the closed door
that we do not see the one which has opened for us.
~ Alexander Graham Bell
For more background information, read About
the Trading Diary.

Author: Colin Twiggs is a former investment banker with almost 40 years of experience in financial markets. He co-founded Incredible Charts and writes the popular Trading Diary and Patient Investor newsletters.
Using a top-down approach, Colin identifies key macro trends in the global economy before evaluating selected opportunities using a combination of fundamental and technical analysis.
Focusing on interest rates and financial market liquidity as primary drivers of the economic cycle, he warned of the 2008/2009 and 2020 bear markets well ahead of actual events.
He founded PVT Capital (AFSL No. 546090) in May 2023, which offers investment strategy and advice to wholesale clients.