Monday Update
By Colin Twiggs
August 7, 2006
August 7, 2006
In response to a number of requests, we will trial a detailed
weekly newsletter on Thursdays and a quick update at the start
of the week. Your feedback
will be appreciated.
These extracts from my daily trading diary are for educational purposes and should not be interpreted as investment advice. Full terms and conditions can be found at Terms of Use.
USA
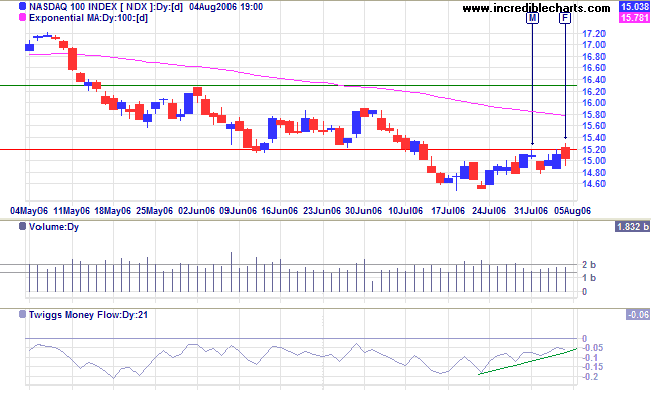
The Nasdaq 100 remains in a primary down-trend after
encountering strong resistance at 1520. A fall below 1480 would
be bearish, while a close below 1450 would confirm the
down-trend. A close above 1520, on the other hand, would be a
sign that the down-trend is weakening.
Twiggs Money Flow (21-day) is below zero but trending
upwards, showing early signs of
accumulation if it stays above the trendline.
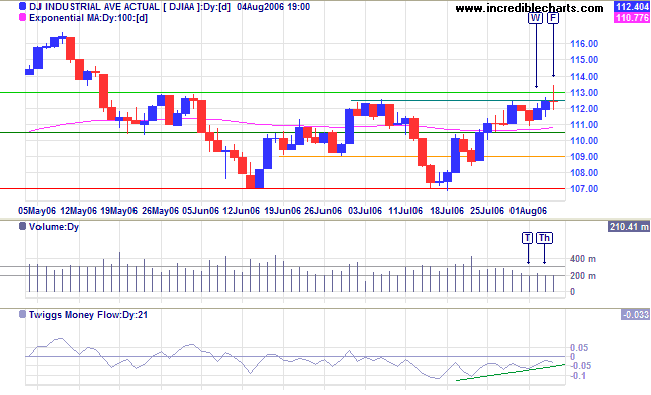
The Dow Industrial Average encountered resistance at
11250 on Friday, with a tall shadow despite low volume.
Twiggs Money Flow (21-day) is below zero but trending
upwards: early signs of
accumulation if it stays above the trendline. A close below
11100 would signal another test of primary support at 10700,
while a close above 11300 would signal the end of the secondary
correction.
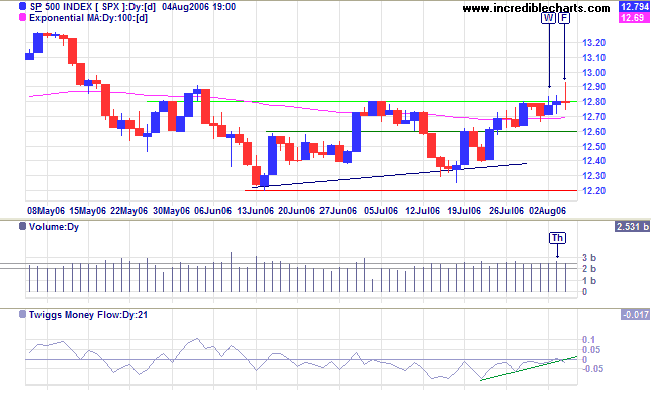
The S&P 500 displays similar resistance, with weak
closes/tall shadows from [W] to [F], but this time on strong
volume.
Twiggs Money Flow (21-day) below zero and breaking below
the trendline signals
distribution. A close below 1270 would signal another
correction, possibly a test of primary support at 1220, while a
close above 1280 would signal the end of the secondary
correction.
Gold
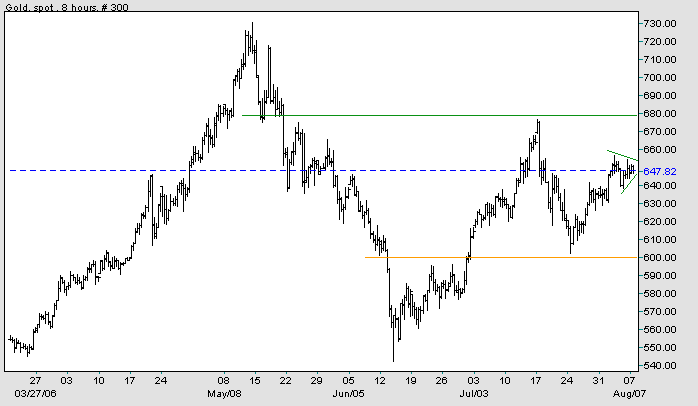
Spot gold has formed a small pennant at $640 to $660, normally a continuation pattern. An upward breakout would signal a test of resistance at $680. A (less likely) downward breakout would test primary support at $600.
Source: Netdania
Currencies
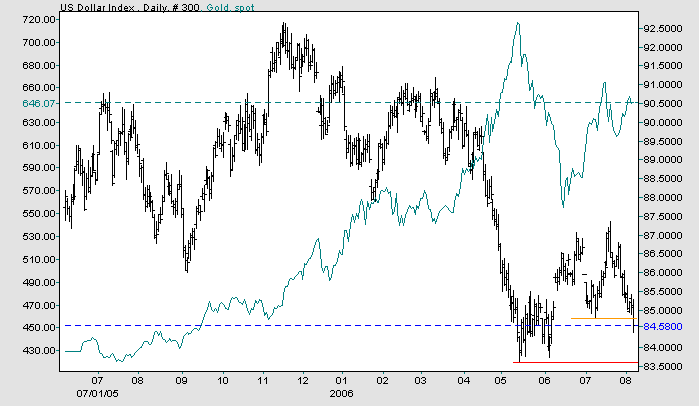
The US Dollar Index is weakening ahead of the Fed's Tuesday meeting, with the market anticipating a pause in rate hikes. In my opinion a rate hike is in the balance: the Fed may still be concerned with recent inflation figures and opt for one last hike before the much-anticipated pause. The dollar is weakening, along with long-term yields.
The index completed a double top and is now headed for a test of major support at 83.50. Expect gold to rally.
Source: Netdania
United Kingdom
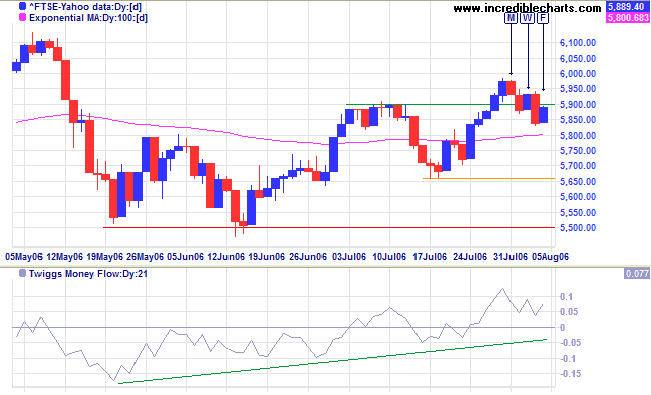
The FTSE 100 dipped below initial support at 5900. Twiggs Money Flow (21-day) is trending upwards, signaling accumulation, so watch for a close back above 5900 to complete a bullish false break. A fall below 5650, on the other hand, would signal a test of primary support at 5500.
Japan
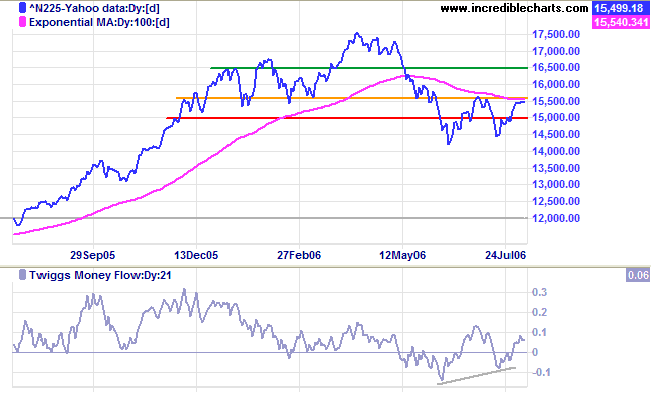
The Nikkei 225 encountered strong resistance at 15500. A down-turn that respects the 100-day exponential moving average would be bearish, but a fall below the recent low of 14500 would confirm the primary down-trend. A rise above 15500, on the other hand, would be a strong bull signal.
ASX Australia
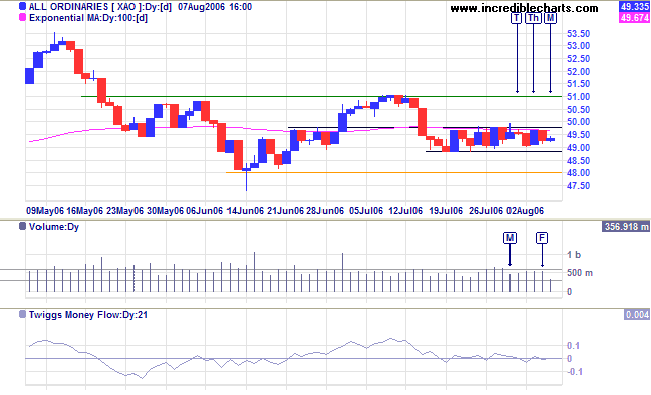
The All Ordinaries continues to show uncertainty, consolidating mid-way between the recent high and low, with Twiggs Money Flow (21-day) whipsawing around the zero line. A close above 4980 would be bullish, while a close below 4880 would mean a test of primary support at 4800.
For more background information, read About
the Trading Diary.